



Predicting attrition: anticipating churn
Darko Macoritto
· 5 min
A BTYD model gives each customer a probability of still being active, from their purchase history alone. That indicator feeds the CRM strategy: cutting churn through targeted action means raising LTV.
Swipe left to read
Keep reading
A BTYD model gives each customer a probability of still being active, from their purchase history alone. That indicator feeds the CRM strategy: cutting churn through targeted action means raising LTV.
Abstract
Securing lasting growth for your company calls for the best acquisition strategy, and for a customer engagement strategy that performs.
Media tactics will generate leads; the CRM strategy will turn them into customers and secure their loyalty.
But your media investment is limited by the amount you are willing to invest to acquire a new customer.
So to afford an ambitious, high-impact media plan, you have to be able to allow yourself a higher acquisition cost. And by the same logic, to allow yourself a higher acquisition cost, you have to generate more margin from each customer — in other words, raise their lifetime value (LTV).
To raise customers’ LTV, you have to concentrate on three lines:
- raising the frequency of purchase
- raising the average basket
- raising customer loyalty (repeat purchase)
Data science is a formidable tool for setting, enriching and refining the strategies able to grow your customers’ LTV.
Method
In this article we concentrate on the last pillar: how to predict your customers’ churn risk, with a view to putting in place the actions that raise the chances of the customer giving up on churning.
Our strategy: build a method and put a prediction algorithm to work, on the BTYD (Buy Till You Die) model
The method used to assess your customers’ probability of attrition is modelled as an algorithm in R or Python. Several models can assess customers’ probability of attrition. They come from the BTYD (Buy Till You Die) family of models, which bring advanced statistical methods to bear in order to predict future customer behaviour in a non-contractual context.
Unlike a contractual relationship, where the customer’s departure has to be announced, in a non-contractual context it is not possible to know with certainty when a customer “leaves” the company, because their departure is not observable. It cannot be established whether a customer is between two purchases or has definitively churned.
To reflect the uncertainty of the non-contractual context, BTYD models assign each customer a probability of being “alive” — of making another purchase in future — against their purchase history. The idea is illustrated by the two examples below:
Example 1: Customer A buys products from our company regularly. Their average purchase frequency is three months. The BTYD model therefore understands that this customer buys on average every three months. If their last purchase was a month ago, the model sees nothing worrying and will assign a fairly high probability of being alive. If, however, they have not bought for six months, the model will understand that something abnormal has happened in their purchasing behaviour, and will assign a markedly lower probability of being alive.
Example 2: Customer B buys products from our company less regularly than Customer A. Their average purchase frequency is twelve months, because they only do their Christmas shopping there. As in the previous example, the model will understand that this customer has their own purchase frequency. If they have not bought for six months, the model will see nothing worrying, because their average purchase frequency is lower than Customer A’s.
The key concept, which gives the whole approach its value, is that the BTYD model assigns a different probability of being alive to each customer, against their purchase history with the company.
The mathematical mechanics of BTYD models are relatively complex, and setting them out is beyond the scope of this article.
Results
One of the strengths of this method is that little customer data is needed to estimate their probability of being alive. It is enough to have each customer’s purchase history, and to calculate the recency (the time between now and customer X’s last purchase) and the frequency (the number of purchases customer X made), in order to run the calculations.
After seven years without a purchase, this customer has only a 4% chance of being active
Probability of still being active, estimated by a BTYD model for a buyer of glasses (“customer 11”), in %, from June 2010 to October 2021. The blue lines mark their five purchases. Move today’s date to see where the customer stood on that date.
Hover the curve to read the probability on a date; click the chart or move the slider to change today’s date. The rest of the curve, still unknown on that date, turns grey.
Source: the BTYD model presented in the article; curve and purchase dates read off its original figure, approximate values (±1 point, dates ±1 month) · Chart: bright.swiss
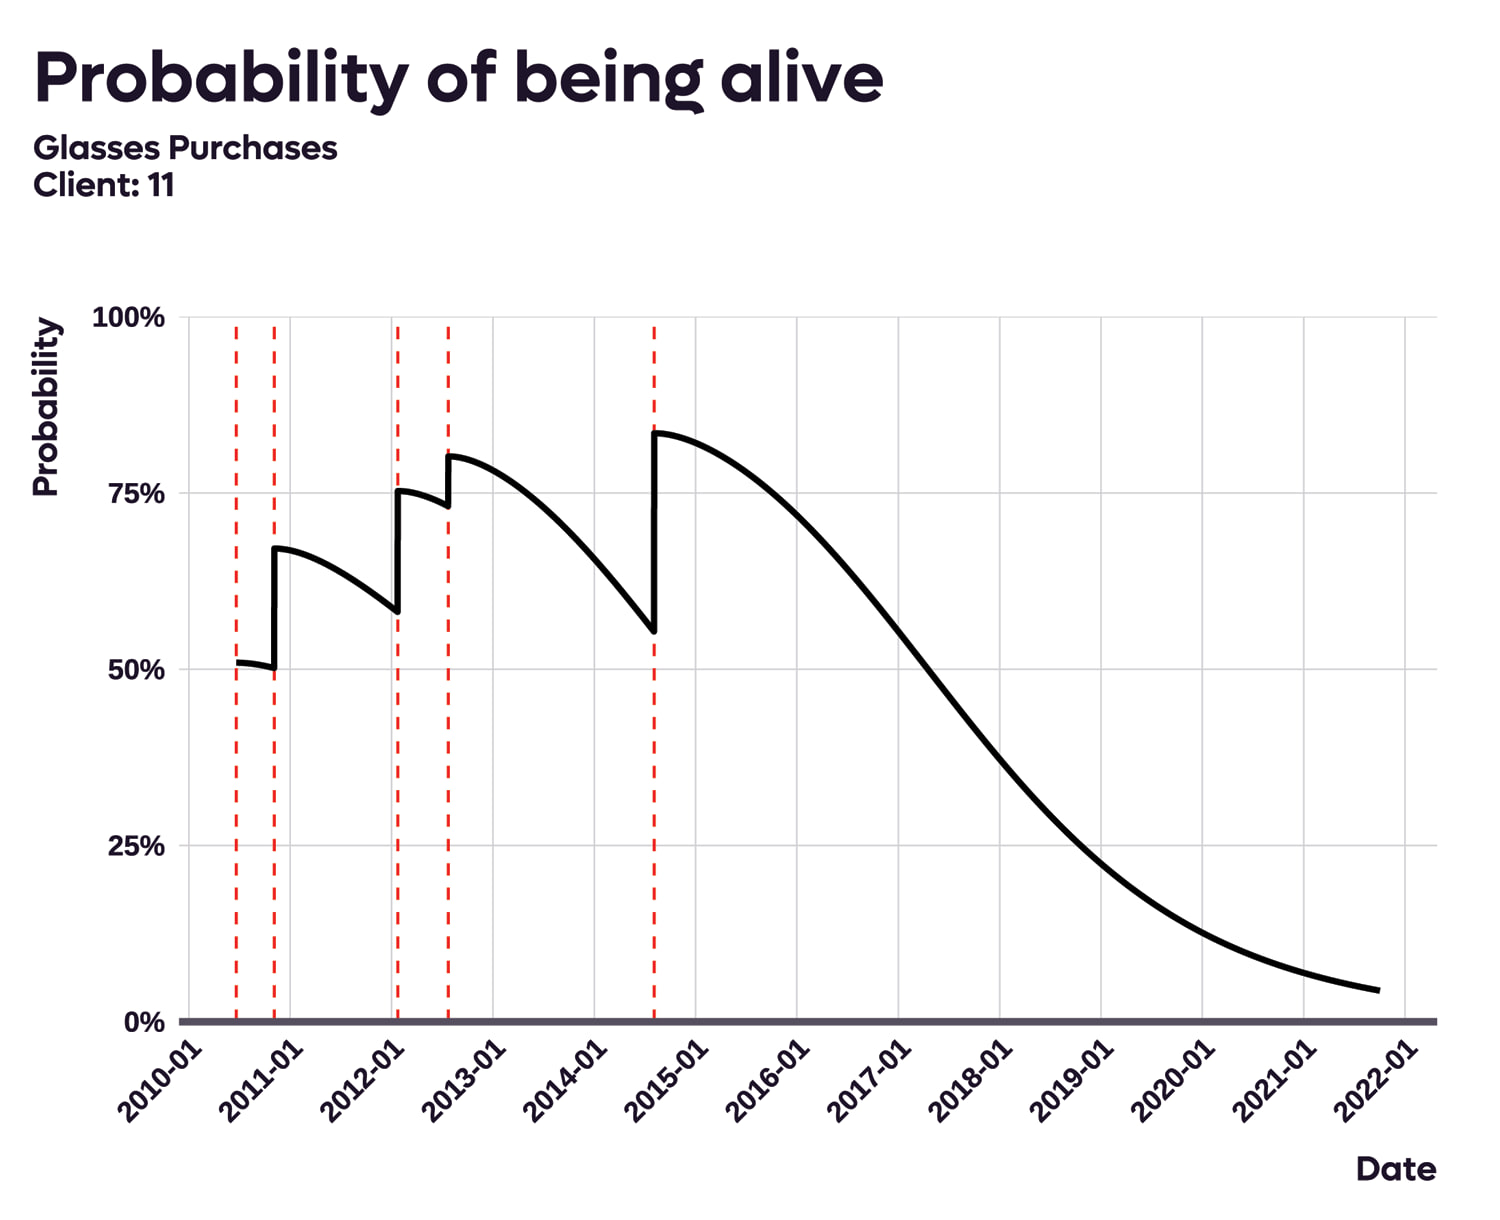
A graphic illustration of how the probability of being alive evolves for a given customer.
Here we can see the model’s mechanics at work for a randomly chosen customer. The dotted blue lines are purchases, while the black line shows the probability of being alive at a given moment. The main visual observations — which follow directly from the mathematical mechanics of the BTYD model — are these:
- Every time this customer makes a purchase, their probability of being alive rises suddenly, reflecting that they are active.
- The height of the jump depends largely on their probability of being alive before the purchase. For two near-consecutive purchases, the probability of being alive rises relatively little.
- The more purchases the customer makes, the closer their probability of being alive comes to 100% after a purchase. That reflects this customer’s loyalty.
- This customer’s average purchase frequency is a few months. Yet they have made no purchase for several years. The model therefore gives them a probability of being alive close to zero.
Uses
Reducing customer attrition — churn — is part of raising LTV.
This tool is extremely powerful for feeding your CRM strategy. The indicator becomes a strategic extra variable for your marketing automation tactics. We can build specific customer segmentations so as to offer reassurance or a commercial gesture, and so cut churn through targeted action.
It also lets you analyse the performance of a loyalty programme, and makes an effective decision-making tool. For Veepee, we developed a churn prediction algorithm for every customer, usable across a great deal of marketing automation.
Implementing the attrition prediction algorithm is now part of the set of analyses we carry out through our data science service. The indicator is strategic, because it contributes to the performance of the marketing we propose to our clients.
The next step will be to enrich the prediction by bringing in the data generated by the specific relationship with a given customer: our aim is to build a hybrid indicator, combining a churn calculation on the transactions (the BTYD method) with the data of the interactions between the customer and the brand.
Analysing verbatims, data from the customer service CRM, will add a new, contextual dimension, refining the churn anticipation indicator while documenting the reasons. In the end the aim remains to understand what your customers expect, through the analysis of data.
Going further
- Lifetime value and retention8 publications


The key skills bright can bring to you