

From Data Science to Growth
Econometrics in the service of marketing.

Building, from customer data, the key indicators for tracking marketing performance.
- Period
- Since 2021
- Services
- Data Science
- LifeTime Value
- Churn prediction
- Client
- Veepee
The well-known e-commerce brand enjoys an excellent reputation in Switzerland, with hundreds of thousands of customers in the French-speaking cantons, won over more than a decade.
We began working with Veepee at the start of 2021, by putting our Data Science programme in place; we then put what it taught us to work in a performance acquisition strategy.
Engagement - Financial data analysis
The aim of the engagement was to produce descriptive and statistical analysis of anonymised customer data, so as to build a set of key indicators for tracking the performance of future CRM and acquisition work.
Strategy - Modelling customer data.
Our strategy was to put the Data Science programme in place, a framework designed by the agency. It gathers the methods, the algorithms and the tools our experts use to analyse data, improve its collection (tracking, data collection), and carry out descriptive, predictive and exploratory analysis.
Once the learning phase was done, we analysed the data to build the marketing KPIs — descriptive and predictive both — that bring growth opportunities into the light.
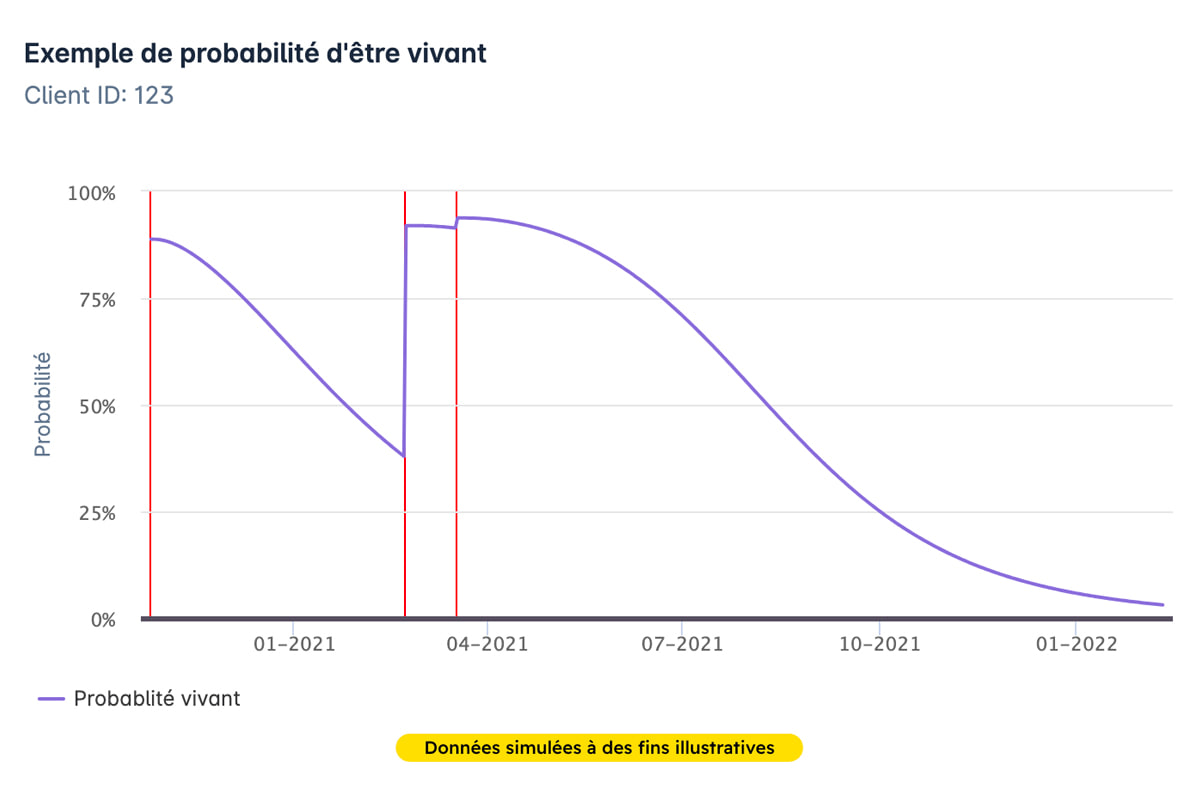
Five months after their last purchase, this customer has only a one-in-two chance of being active
Probability that a simulated customer (“customer 123”) is still active (“alive” in the sense of the churn model), in %, from October 2020 to February 2022. The blue lines mark their three purchases. Move today’s date to see where the customer stood on that date.
Hover the curve to read the probability on a date; click the chart or move the slider to change today’s date. The rest of the curve, still unknown on that date, turns grey. The segment uses the thresholds of the segmentation chart: inactive below 28%, active above 60%.
Source: data simulated for illustration, Bright; curve and purchase dates read off the original figure, approximate values (±1 point, dates ±3 days) · Chart: bright.swiss
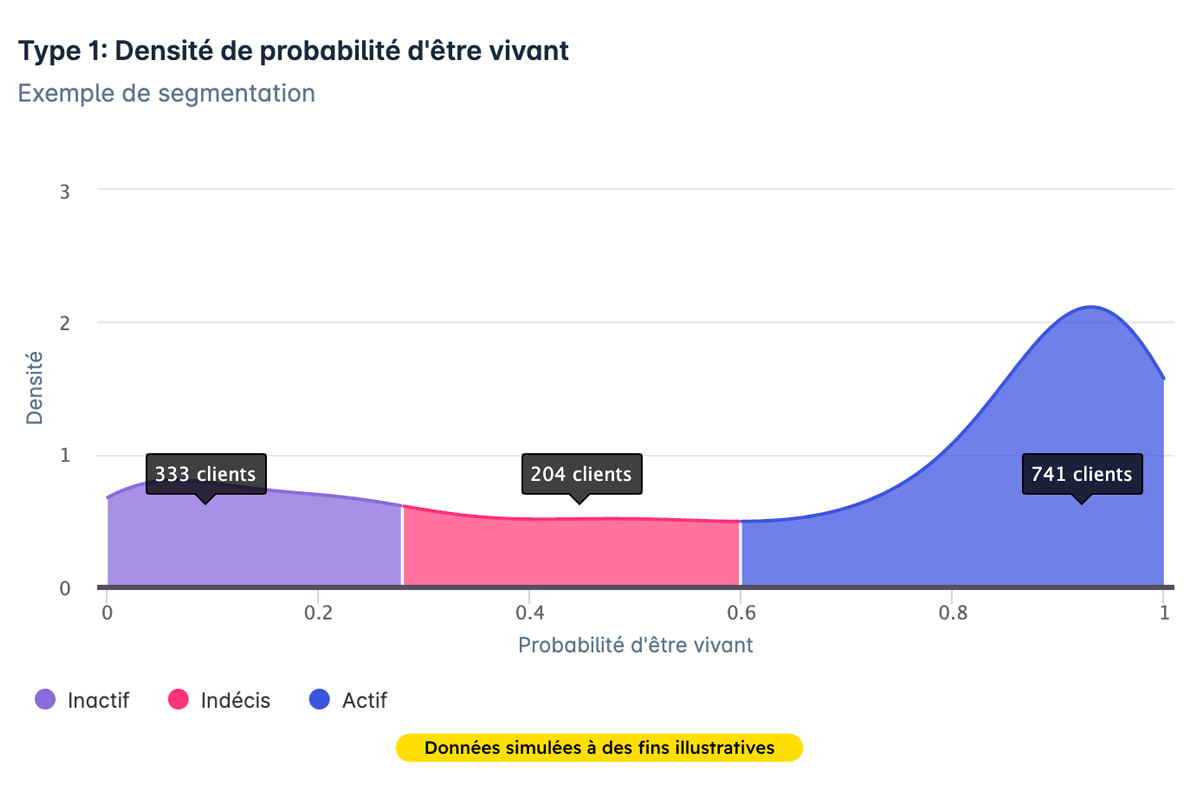
58% of customers are active, but one in four is already inactive
Distribution of 1,278 simulated customers by their probability of being active (“alive” in the sense of the churn model), as a number of customers per 2-point band. Segments at the thresholds of the study, 28% and 60%; move the thresholds to recount the customers in each segment.
Hover a bar to read its number of customers; click the chart to bring the nearest threshold there.
Source: data simulated for illustration, Bright; distribution reconstructed from the density curve and the counts of the original figure (333 inactive, 204 undecided and 741 active), approximate values · Chart: bright.swiss
Impact
A data-driven action plan in the service of growth.
Our analyses built decisive KPIs such as LifeTimeValue, which, crossed with other indicators, revealed concrete paths to growth.
The richness of the data let us develop a churn prediction algorithm for every customer. A strategic indicator that can be put to work in a great deal of marketing automation.
Taken together, the analyses let us document and cost an action plan of more than 30 projects, from the simplest to the most ambitious.
CRM – A new, data-driven segmentation was proposed, which identified both a panel of high-value customers and those at high risk of churn.
Acquisition – An acquisition strategy was launched across several digital media channels, covering the whole of Switzerland.
The analysis carried out through the data science programme was the key to the acquisition campaigns’ success. Figures such as the second-level conversion rate specific to customers coming from the campaigns, how customer conversion moves over time, and how LTV varies with the products bought on a first order, among others, were decisive in tuning the campaigns finely and so getting the most out of them.