



Calibrating campaigns to maximise profit
Steve Savioz
· 6 min
A campaign’s profit is defined as the gross margin it generates, less its costs. The first step is to establish how much a new customer brings on average — in other words, to calculate their lifetime value (LTV) as precisely as possible.
Swipe left to read
Keep reading
A campaign’s profit is defined as the gross margin it generates, less its costs. The first step is to establish how much a new customer brings on average — in other words, to calculate their lifetime value (LTV) as precisely as possible.
Step 1: calculating lifetime value (LTV)
To work out how much a new customer brings, it would be wrong to take only the margin generated on their first order, since many will probably buy again in future. The marketing effort made over a given period will therefore generate revenue over time, hence the importance of establishing the average lifetime value (LTV) of each group, or cohort, of customers. That is the sum of the gross margins each customer generates over their life as a customer.
To establish a group’s average LTV, it is hard to rely on general market data, since so many parameters can move that value. The best solution is to analyse how the attrition rate — the churn rate — has moved in the past, and to project that loss of subscribers or customers into the future, so as to estimate future revenue.
Once those values are estimated for a given group, the average LTV of the customers in that cohort becomes the whole of the gross margin the cohort generates — future projections included — divided by the number of customers in it (the number at the outset, not the number still active).
To remember:
Note that LTV varies greatly between customers, against criteria such as where they came from in marketing terms, whether they had a discount code, which subscription they first took out and so on. Each of those cohorts therefore has to be defined properly, and each one’s LTV analysed.
The 2012 customers doubled their LTV between the first and the seventh year
Average cumulative gross margin per customer (LTV), in CHF, against the number of years since sign-up; one line per sign-up cohort, 2012 to 2018. Choose a cohort, or hover a line.
Source: the article’s illustrative example, values read off its original figure · Chart: bright.swiss
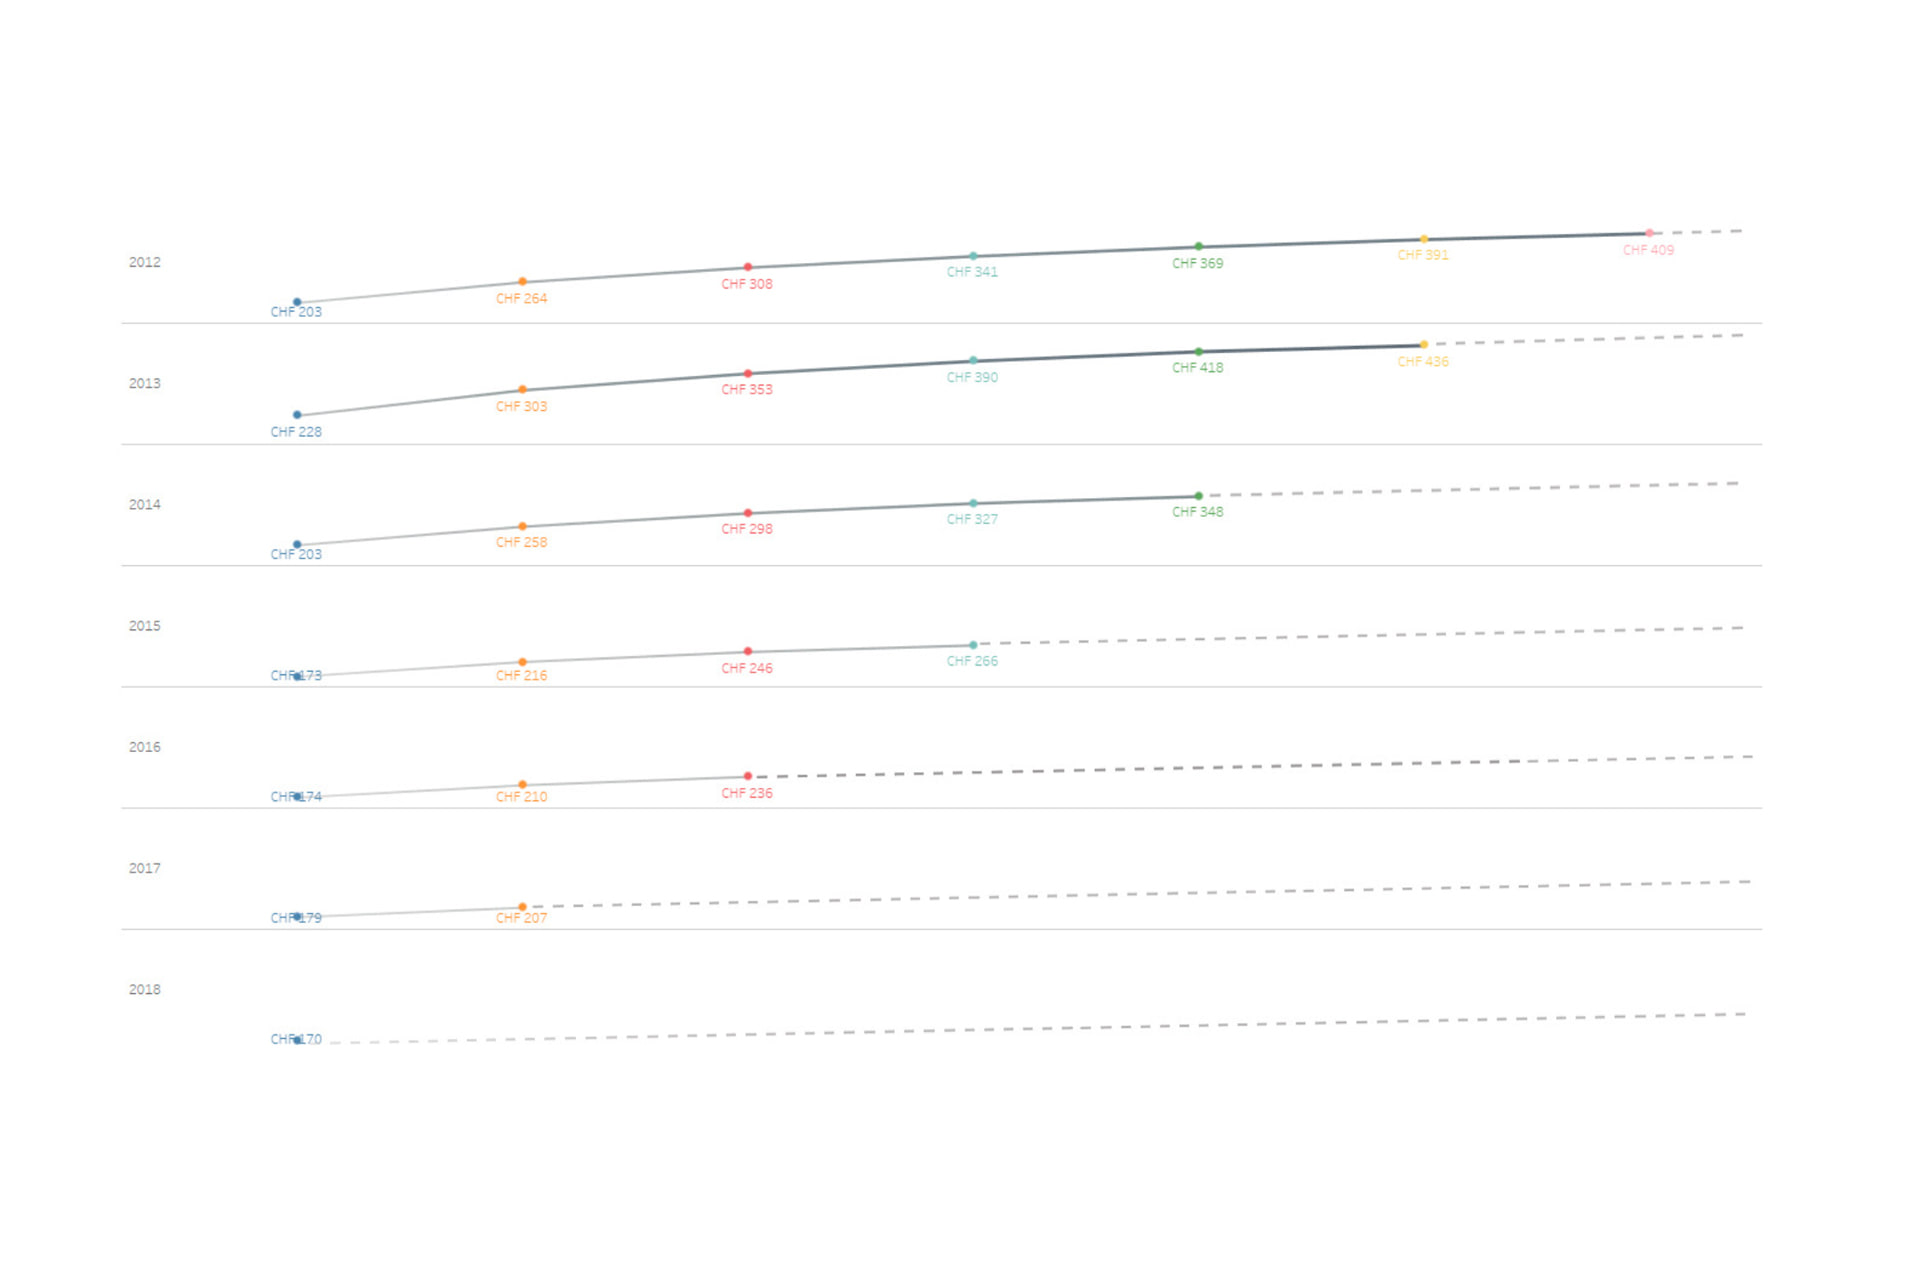
We use spreadsheet models to refine these calculations; here is a visual representation by way of example.
What to read in this chart:
- The curves show how the average margin generated by customers evolves over time, by the year they registered.
- The dotted lines are estimated future data.
- The end of the curve, where it flattens, is the estimated LTV.
- Only once the average lifetime value per cohort is established can you begin to optimise your marketing strategy for profit.
Step 2: calculating the optimal profit point.
In general, the more marketing you do, the more a new customer costs.
You start with the cheapest channels, the most precise audiences and so on. As soon as it comes to expanding, the audience widens and costs more[2] — as is the case for most marketing channels, online and offline.
Take Google Ads, to sharpen the understanding of that phenomenon. Google Ads works by auction: the more you bid, the higher your ad sits in the search results, the more clicks you get and therefore the more customers. But each click, and therefore each customer, costs you more and more.
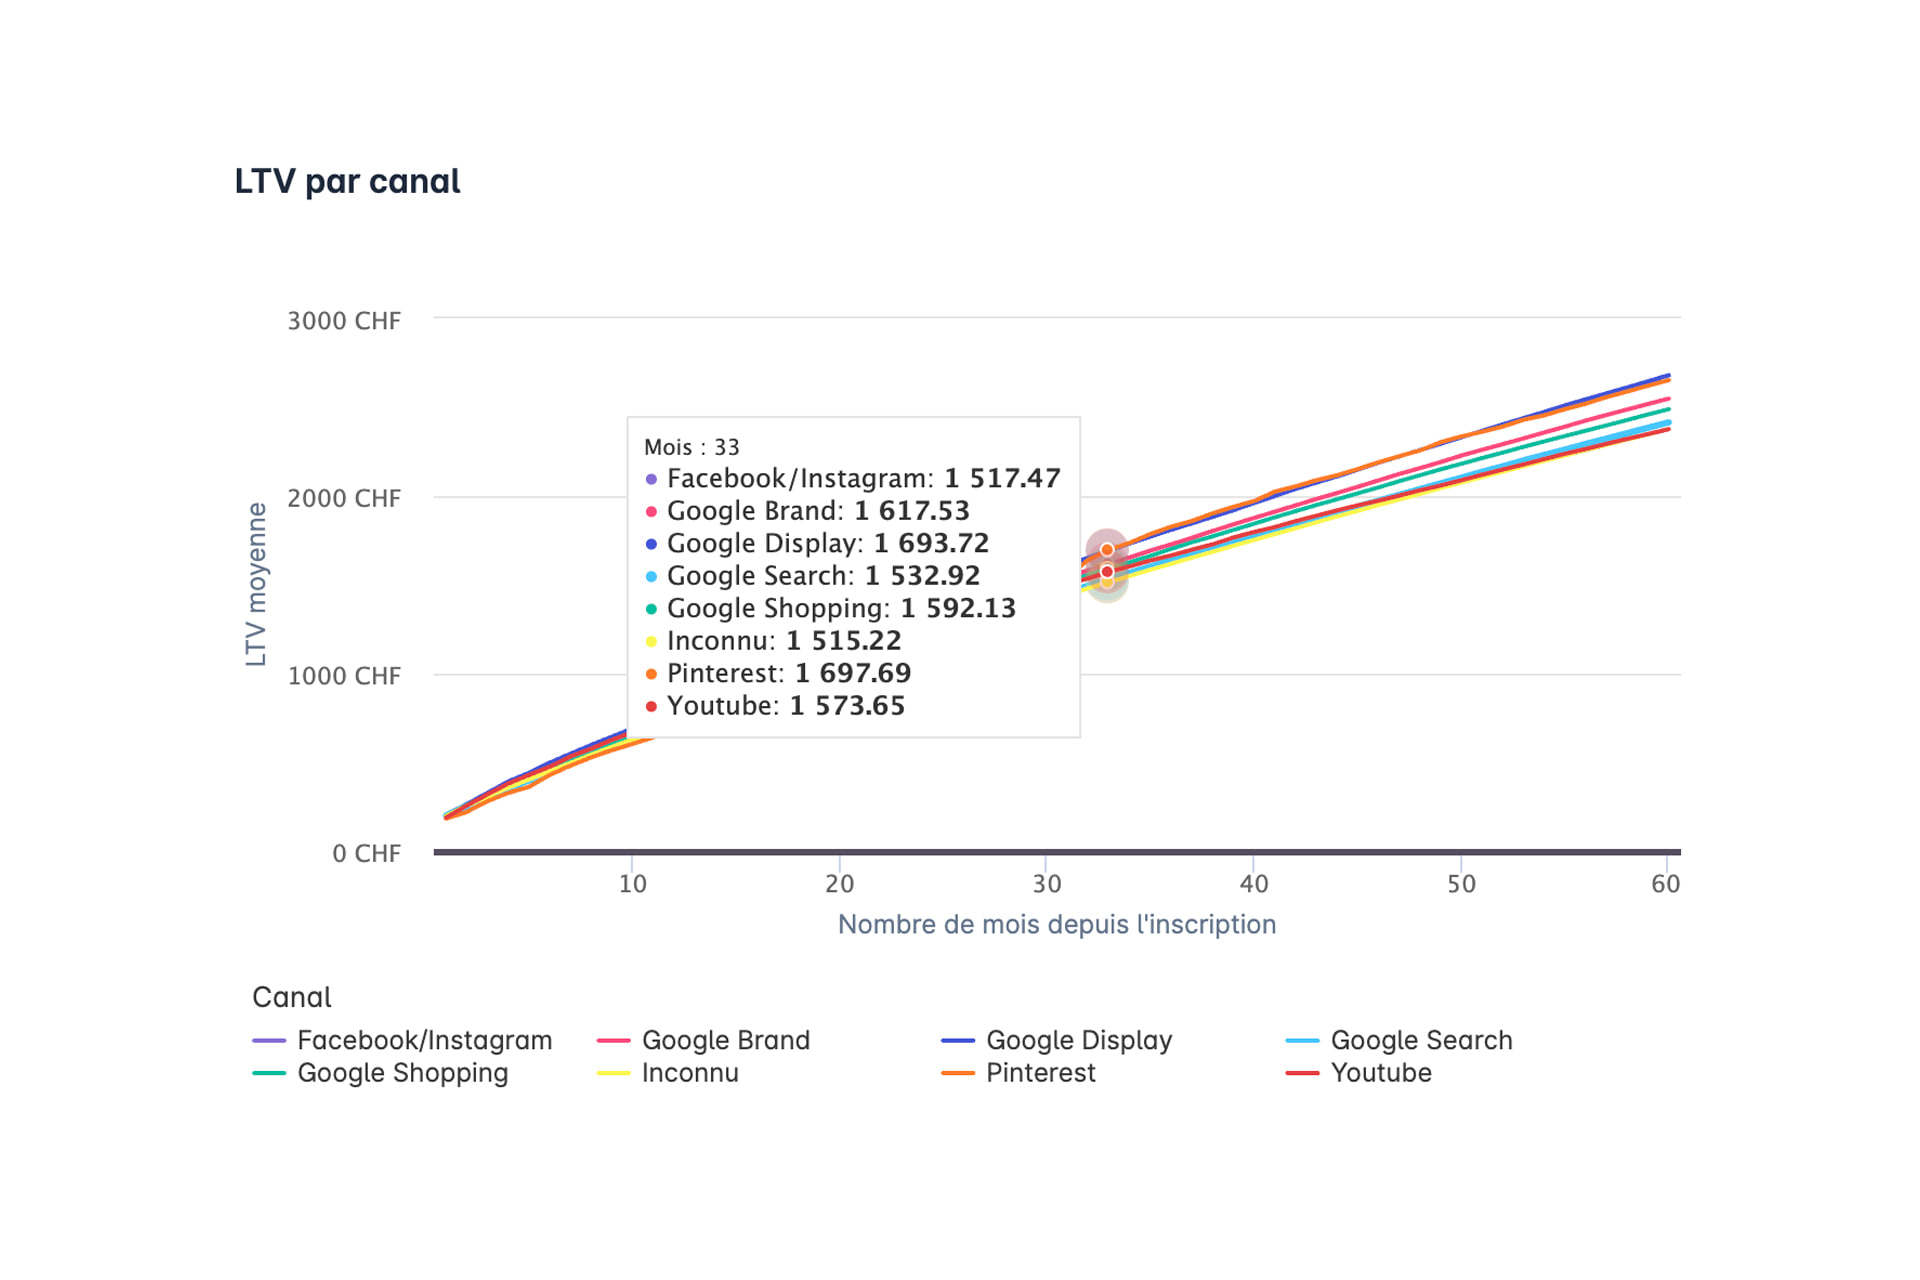
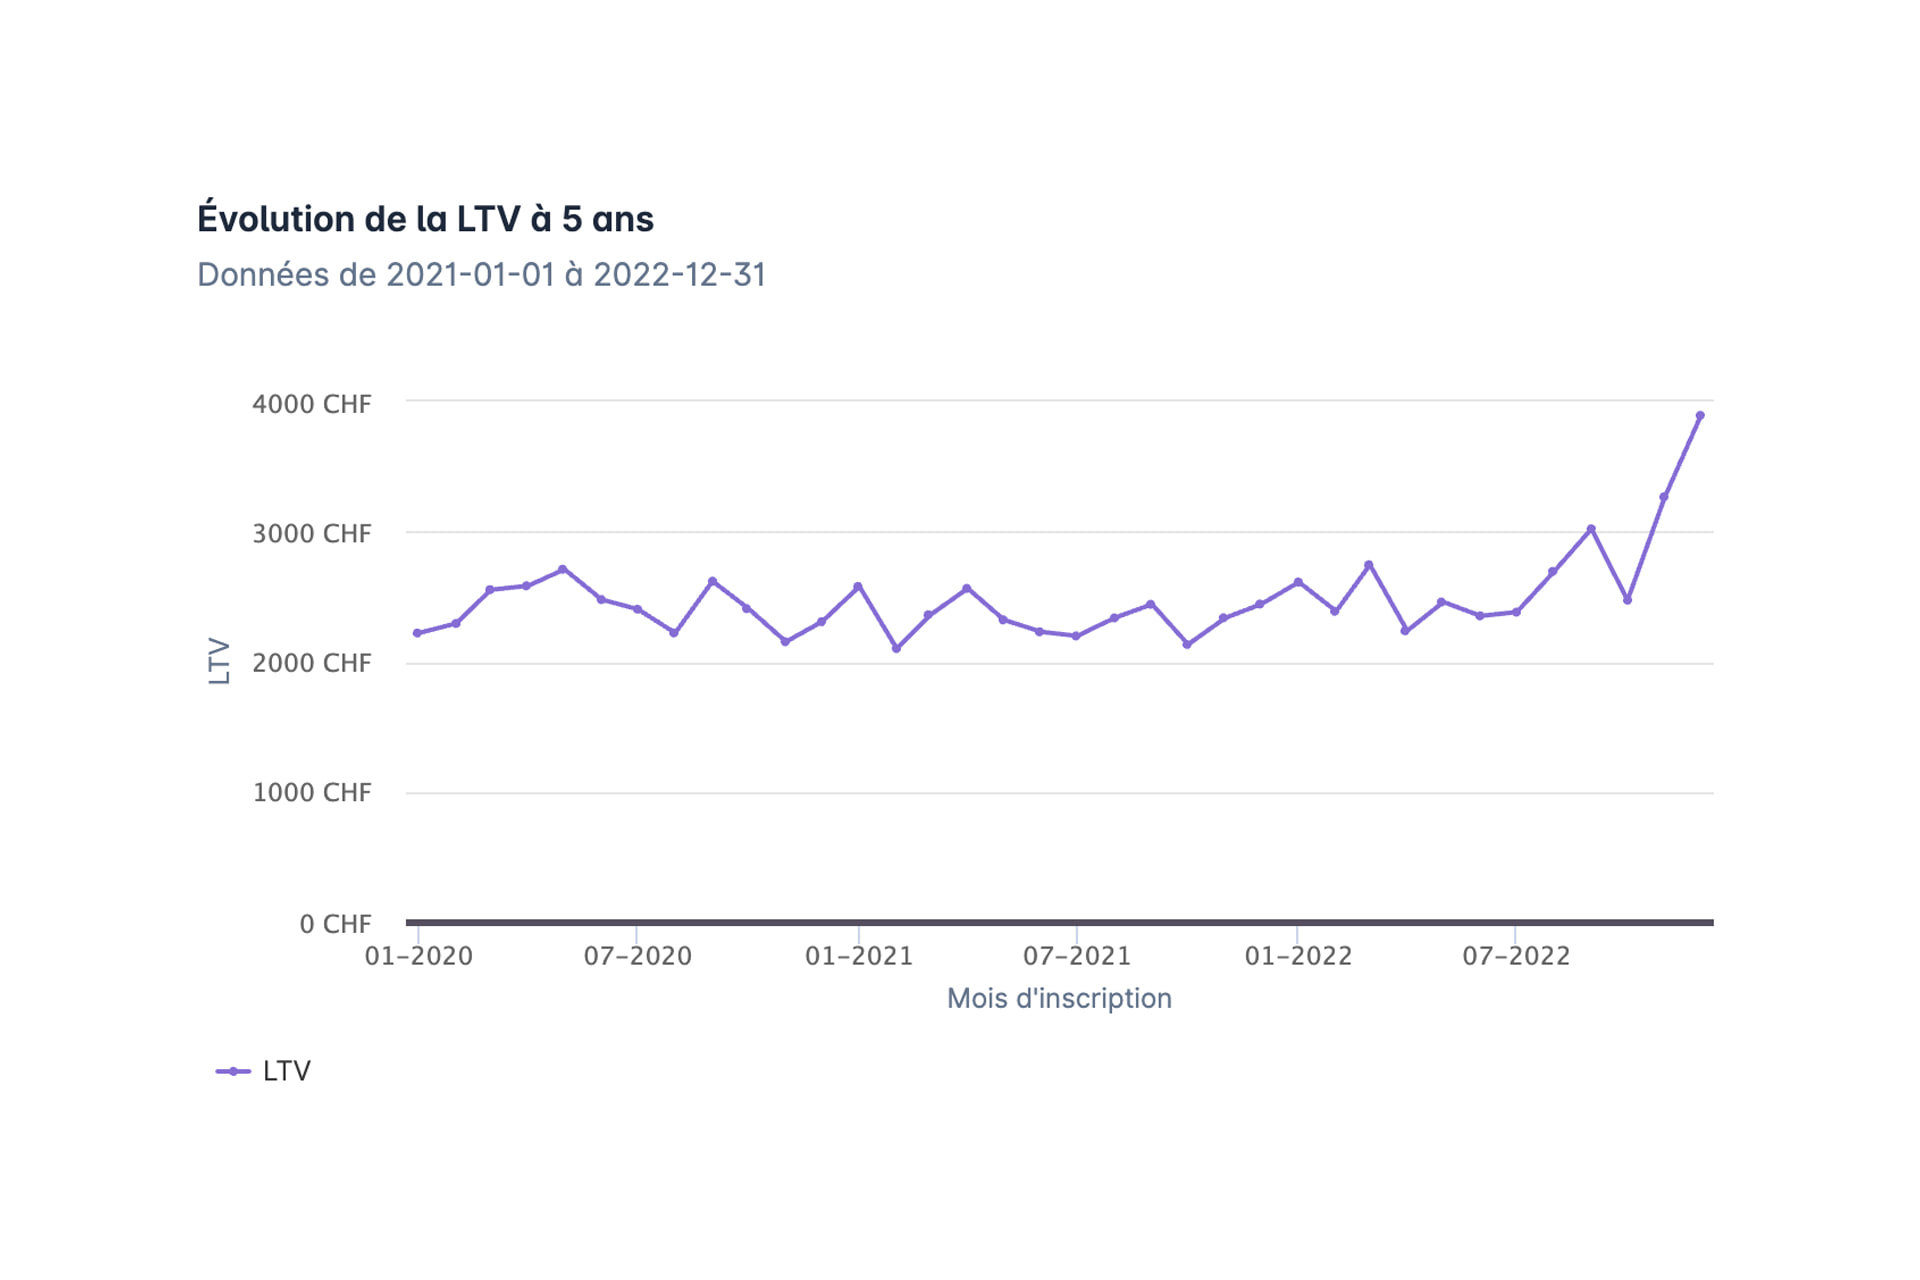
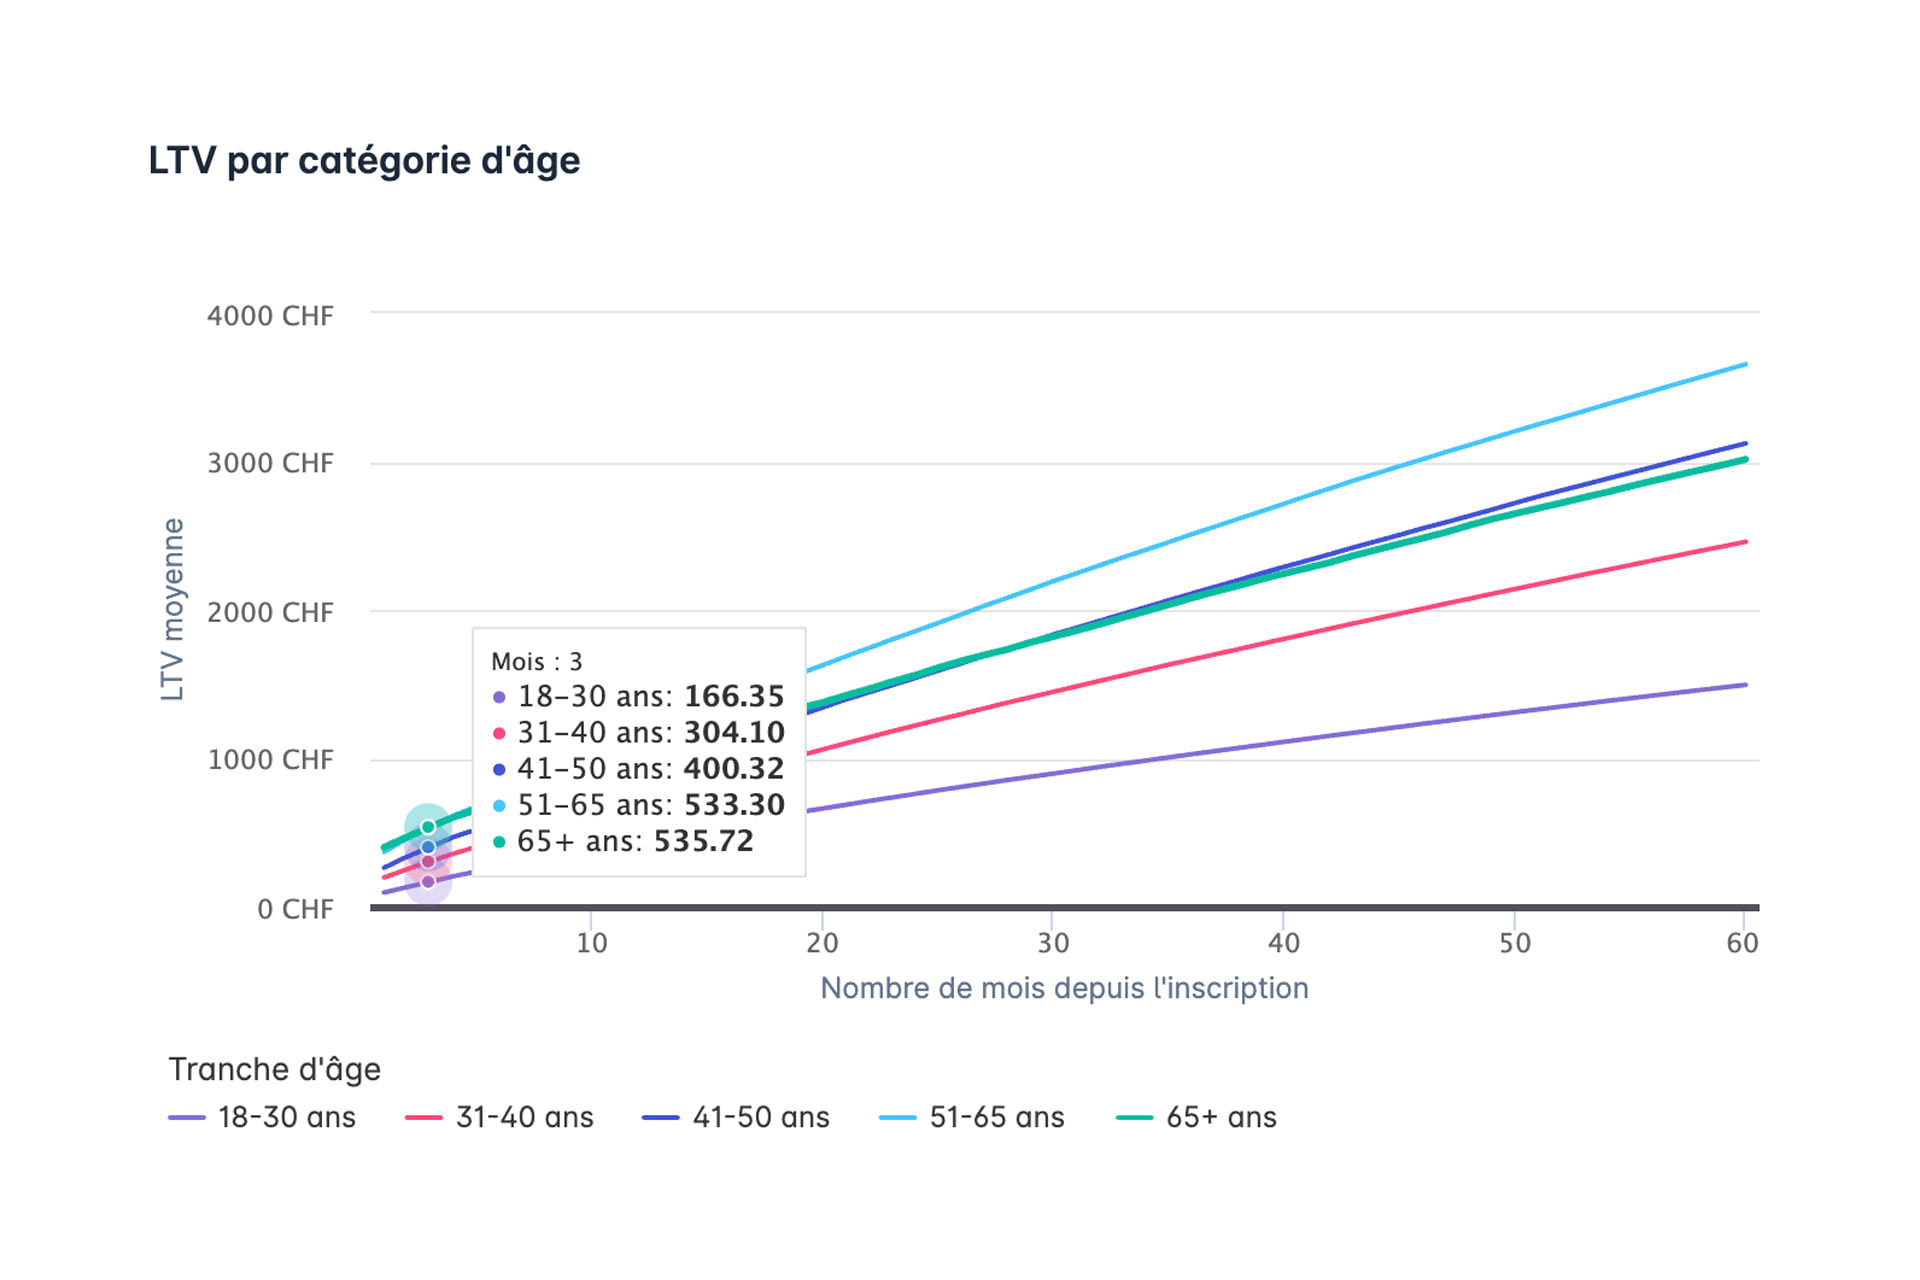
LTV calculated across different cohorts.
A customer’s LTV varies with their acquisition channel, their age and their month of sign-up
Average LTV per customer, in CHF, calculated by bright’s tool for three cuts of the same customer base.
Source: bright’s LTV calculation tool, screenshots published in this article. Exact values: the tool’s tooltips; approximate values (≈): read off its curves · Chart: bright.swiss
Here is how your profit is established:
Profit = (customer LTV – customer acquisition cost) × number of customers.
By way of example, take the following cases:
Say your customer brings you 100 euros (customer LTV = 100 euros).
Consider also that:
- An acquisition cost of 30 euros per customer brings you 10 customers (A)
- An acquisition cost of 60 euros per customer brings you 20 customers (B)
- An acquisition cost of 80 euros per customer brings you 30 customers (C)
By the equation,
- Case 1 brings you (100 – 30) × 10 = 700 euros
- Case 2 brings you (100 – 60) × 20 = 800 euros
- Case 3 brings you (100 – 80) × 30 = 600 euros
Conclusion: case 2 is therefore the most interesting.
What to understand from this example is that, moving from case 1 to case 2, you lose a little margin per customer, but the rise in the number of customers makes up for the margin lost on each. Moving from case 2 to case 3, however, the margin per customer keeps falling — except that here, the rise in the number of customers no longer makes up for that loss.
Case 2 brings in the most: 800 euros, against 700 and 600
A campaign’s profit in the article’s three cases, in euros: each customer brings in 100 euros (LTV); the acquisition cost per customer and the number of customers change from one case to the next. Choose a case.
Margin per customer × number of customers
Profit, in euros
each rectangle’s width is the number of customers and its height the margin per customer, the LTV minus the acquisition cost; its area is the profit. The grey outlines are the other two cases.
Source: the article’s example · Chart: bright.swiss
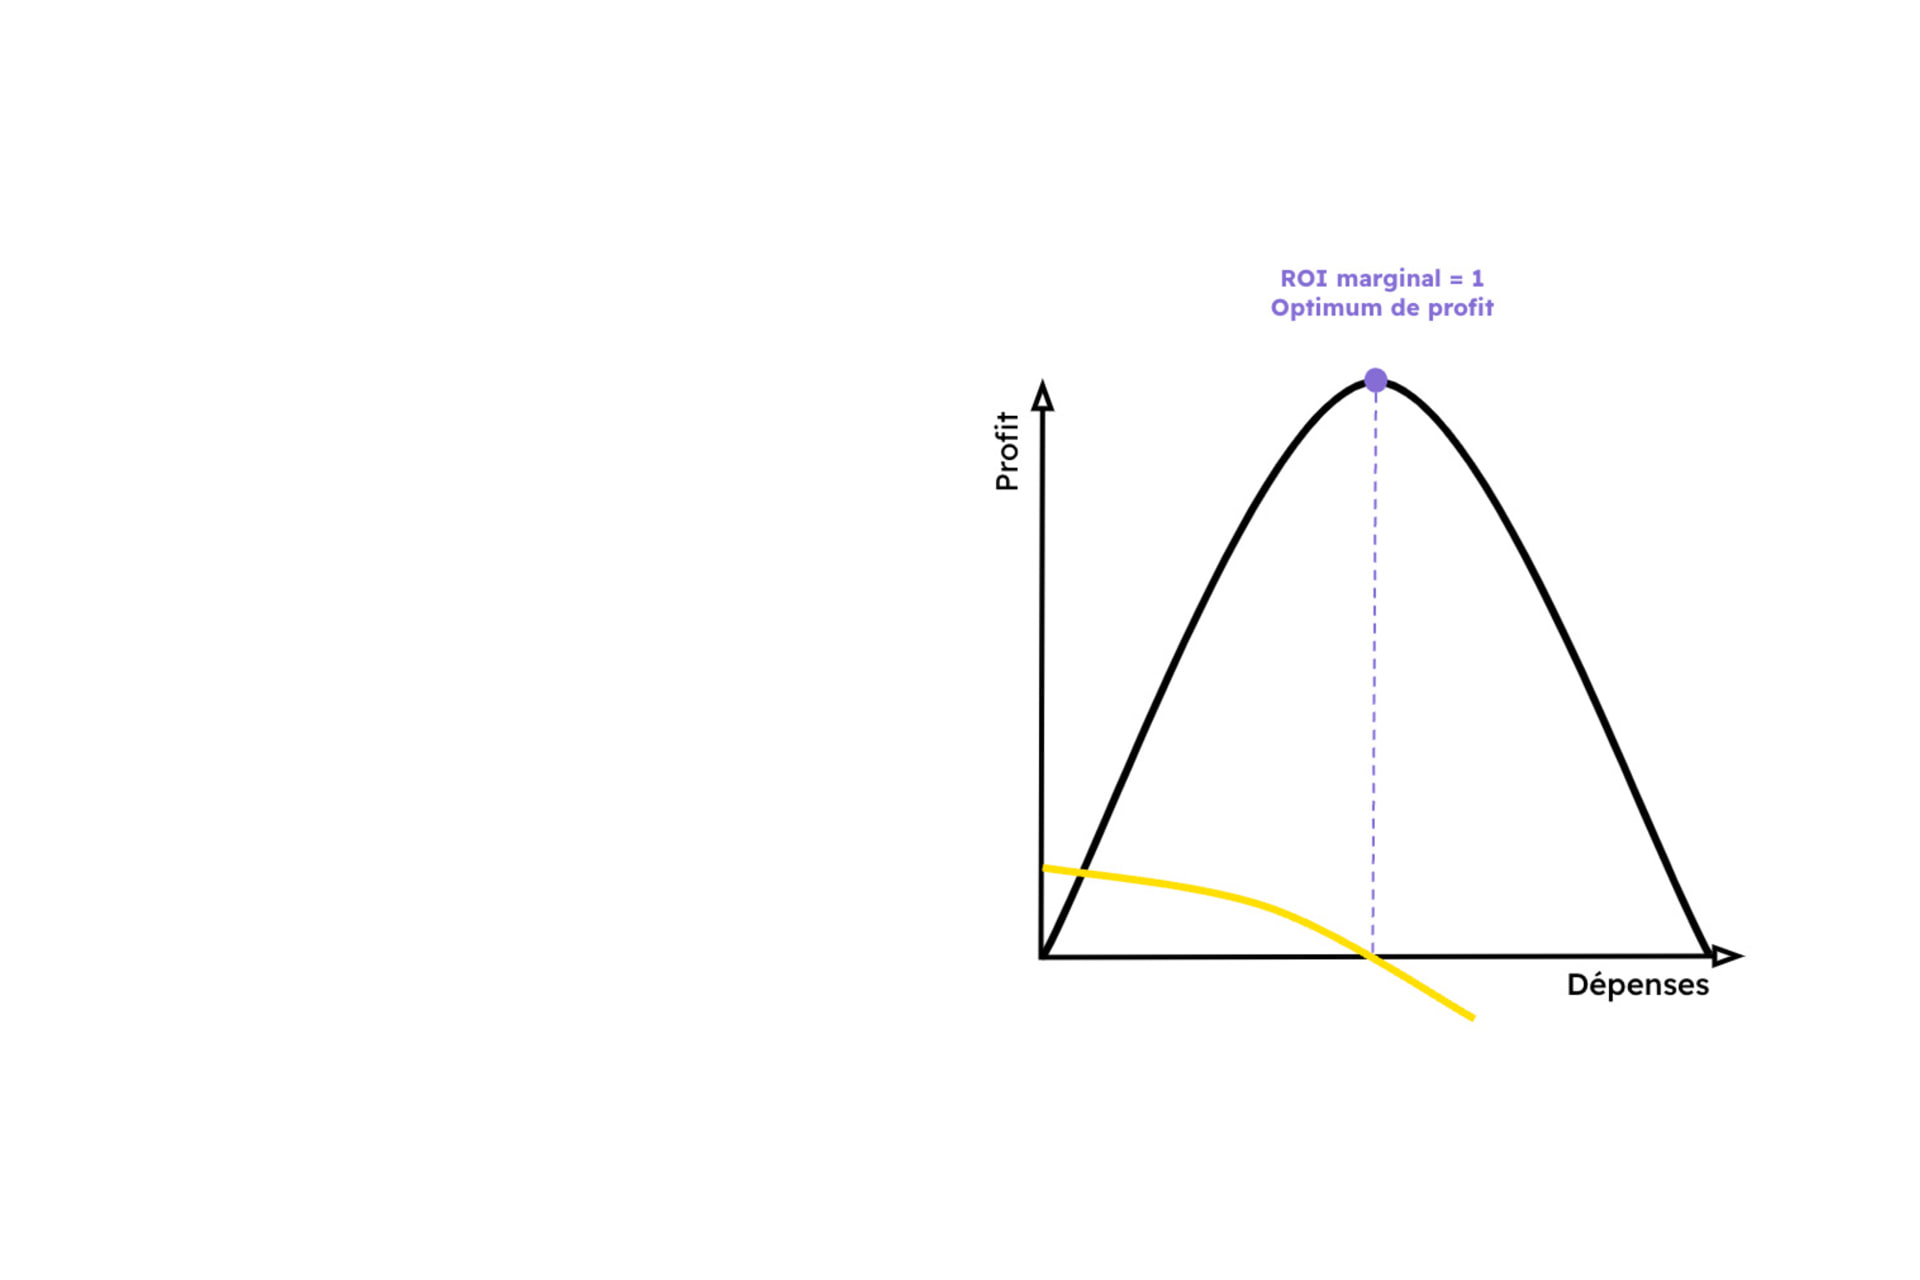
The equation opposite describes a curve that determines the outcome of most marketing strategies.
The curve above shows that when marketing investment is low and you raise it, at first the quantity of new customers makes up for the fall in margin per customer, up to an optimum; and that beyond that optimum, the rise in the number of customers no longer makes up for the falling margin per customer — hence the fall in profit.
Effective ROI-minded marketing seeks to reach that optimum. That search has to be carried out within each channel. In the Google Ads example, the price of every keyword has to be set so that each reaches the optimum of the profit it brings.
Looked at through “marginal” profit
Maximum profit is reached at the point where, over a defined period, every new customer cost less to acquire than they bring, and where any further customer would cost more than they bring. That way you capture every “profitable” customer and your marketing investment is optimised: you are at the optimum of the profit curve.
Calibrating your marketing campaigns to maximise profit therefore means recruiting every future customer who costs you less to acquire than they bring. At Everlife, it is that optimisation at the profit optimum that made such effective growth possible.
Step 3: following the projected profit
How do you steer a business while seeking to maximise its profit?
Monthly marketing costs must not be analysed against monthly revenue or gross margin, because those figures also take in the results generated by earlier customers, which have (in the case analysed here) very little to do with the current campaign.
Marketing costs must therefore be analysed against the customers that campaign alone generated, and the gross margin they will bring — in other words, their LTV.
Steering marketing to maximise profit calls for bringing two elements together:
the projected gross margin generated by the customers coming from the campaign (number of customers the campaign acquired × LTV)
the campaign’s costs
From that, a campaign’s projected profit can be calculated:
Projected gross margin generated by the customers – campaign costs = projected campaign profit.
To remember:
To manage your marketing while maximising profit, you have to follow how projected profit moves as the campaigns change, as the chart opposite shows.
On the margin already earned, the 2022 campaigns look loss-making; on the 5-year LTV, they bring in 2.2 times their cost
Gross margin of the customers acquired each month, already earned (current margin) or projected over 1, 3 or 5 years (LTV), against that month’s marketing spend, in thousands, from January 2018 to December 2022. Choose the LTV horizon.
Source: the tool screenshot in the article (example company), series read pixel by pixel, approximate values (±5k, ±10k on the steepest peaks), currency not stated · Chart: bright.swiss
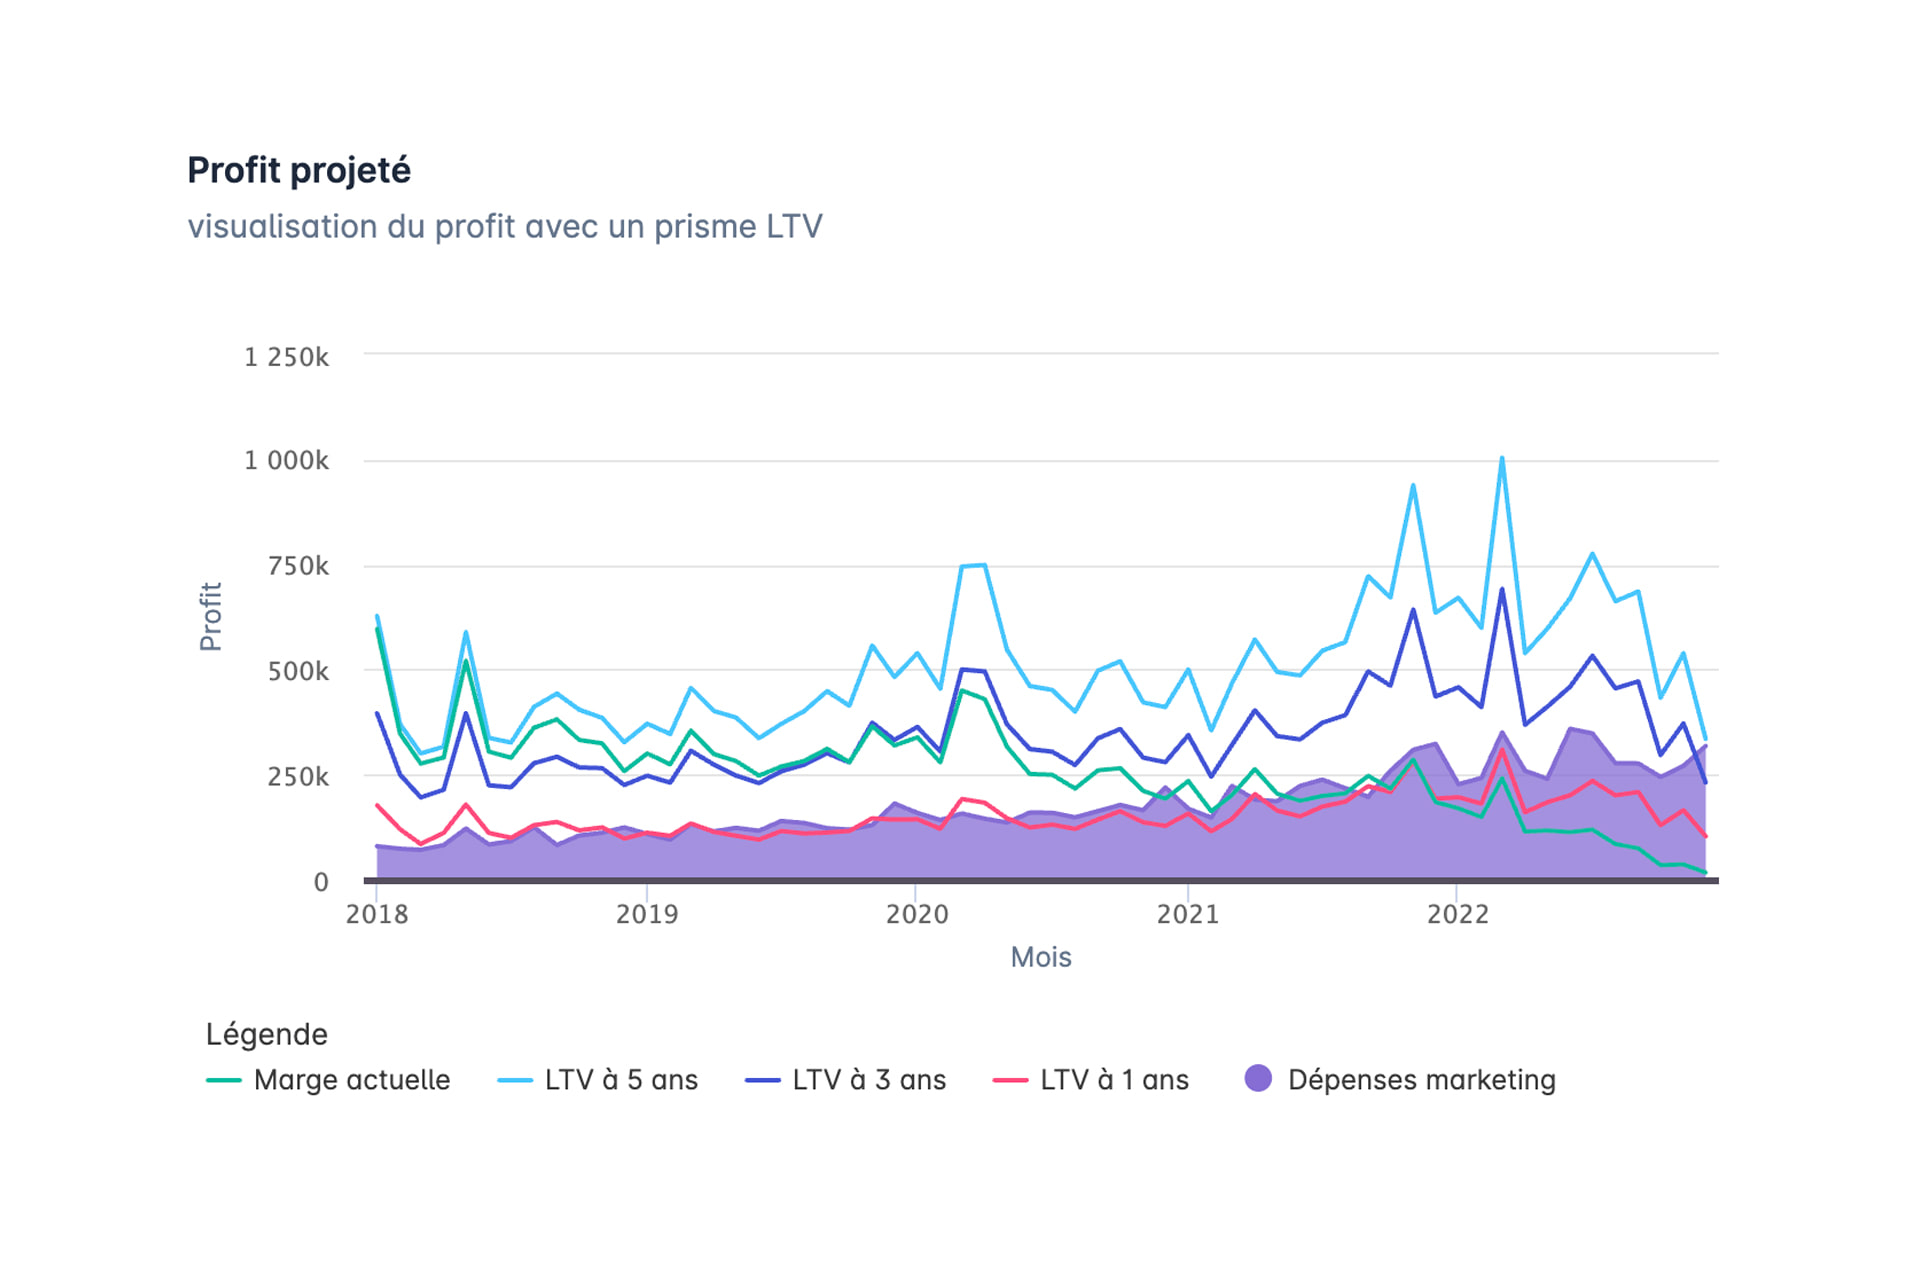
This chart projects how a business’s profit evolves as a whole. To maximise your profit you will nonetheless have to analyse that evolution for each channel, and for each of its sub-categories.
That is a process you will generally not be able to carry out by hand, given the amount of data to analyse. The granularity this method calls for means using fitting tools.
At Bright we use specific tools available on the market, but also proprietary tools we developed to answer these questions.
The first chapter of a complex question
This article is the first chapter of a complex question. The following themes will be covered soon, to show their impact on maximising profit:
- The effect of marketing campaigns on existing customers. That is why the equations defined here suit subscription models such as SaaS, and less so e-commerce, which calls for equations of its own.
- The attribution model. The concept developed above is free of the attribution model, since its starting point sits after the customers’ origin has been established. We will nonetheless need to develop that theme when we introduce the notion of existing customers.
- The budget. We consider in this article that the marketing budget is unlimited, that actual marketing spend is floating and therefore follows from the optimisation that reaches maximum profit. Specific rules apply when the budget is limited.
- The cost of money. We ignore the cost of money here. That notion will have to be covered later, since revenue generated by a customer today or in five years does not have the same value — all the more so if fundraising, and therefore shareholder dilution, is needed to finance the business.
- The effect of “refer a friend” and of word of mouth, which weigh considerably on how marketing campaigns are calibrated.
[1] Gross margin is defined as revenue excluding tax, less the variable costs tied to that revenue, marketing aside.
[2] For simplicity, our examples do not take into account the effects of repetition or of combining marketing, which can improve performance.
The series : Profit, marginal ROI and lifetime value







- Lifetime value and retention8 publications
- Performance management19 publications
The key skills bright can bring to you