


K-means clustering in the service of CRM
Darko Macoritto
· 8 min
Manual segmentations such as the RFM model rest on arbitrary rules and three fixed axes. K-means clustering, semi-automated and far more flexible, lets you segment across a multitude of dimensions.
Swipe left to read
Keep reading
Manual segmentations such as the RFM model rest on arbitrary rules and three fixed axes. K-means clustering, semi-automated and far more flexible, lets you segment across a multitude of dimensions.
Introduction
Clustering (segmentation)
Segmenting and targeting prospects and customers well is of capital importance to any company.
It lets needs be answered better, and marketing answers be made more relevant because they are personalised. Giving more budget to the segments that pay better, and focusing less on those that pay less, are also decisions good segmentation makes possible.
In time, good segmentation makes for better engagement and should translate into a lift in sales.
In this article we present a method of segmentation that is:
- Driven by the data,
- Able to make segments combining many dimensions,
- Able to create segments automatically,
- Easy to reproduce and to modify,
- Easy to fit into a continuous process (new customers, new transactions and so on)
But before that: what does it consist of, and what are the best methods of segmentation? That is what we will explain in this article, using the RFM model and the use of clusters to illustrate the benefits and drawbacks of segmentation methods.
N.B.: the technical aspects are explained at the end of the article.
Abstract
In general, segmentation means grouping data into distinct, mutually exclusive subgroups.
In a marketing setting, the aim is often to group similar customers, so as to address each segment uniformly and appropriately. A company may, for instance, decide to form segments by the characteristics of the people in them.
By demographic, geographic or behavioural criteria, for example: buying habits, age, gender, income and so on.
Segmentation can be done by hand or algorithmically. While a manual approach is often more intuitive and easier to understand, machine learning algorithms can identify patterns that are hard to spot, and reduce the arbitrary share of the choices made.
Among other positives, algorithms can handle quantities of data too large for a human being.
Let us begin by explaining a manual model:
The RFM model
The RFM segmentation model is a tool commonly used in marketing to analyse customers and segment them by their value to the company. The segmentation rules are often defined by hand. In general they turn on three criteria:
Recency: the time since the last transaction.
Frequency: the number of transactions made.
Monetary: the total amount of the transactions.
By their RFM score, customers are sorted into groups — those who buy regularly, those who bought only once, those who made a large purchase and so on — by their perceived quality. Recency and frequency alone are also enough for our attrition prediction model to estimate whether a customer is still active.
The best customers buy often and recently, the worst rarely and long ago
Segments of the RFM model positioned by the recency of the last purchase and the frequency of purchases. An illustrative diagram, with no data. Hover, tap or step through a segment with the keyboard to read it.
The amount spent (M), the model’s third criterion, does not position the segments: only recency and frequency do. Segment boundaries read off the article’s figure. With the keyboard: Tab, then the arrows to move from one segment to its neighbour.
Source: the article’s RFM diagram · Chart: bright.swiss
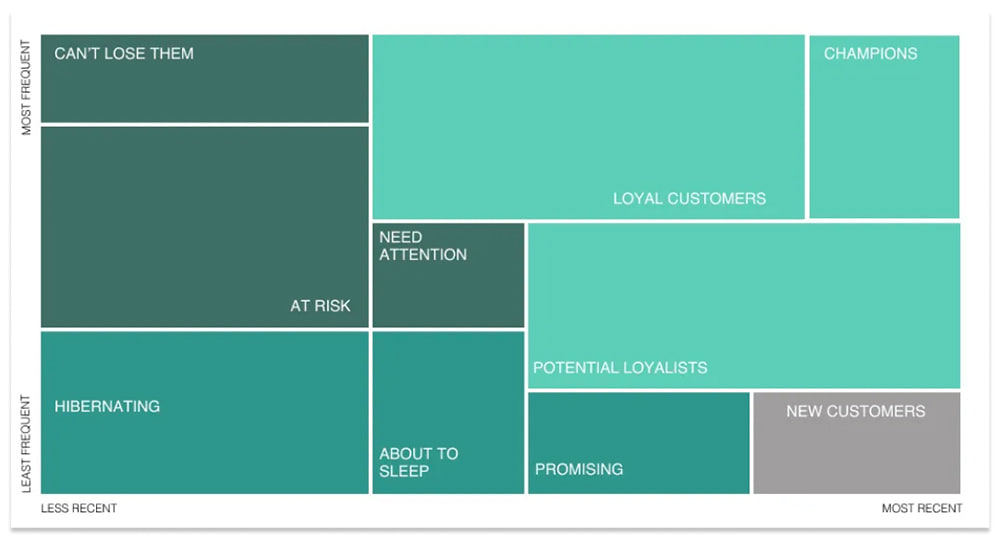
Customers with low recency, high frequency and a large purchase amount will be the best customers — in this example, the “Champions” segment. Conversely, customers who made only one purchase long ago will be the least good, and will be placed in the “Lost” or “Hibernating” segment, for instance.
Commonly used as this method is, it carries a few drawbacks:
- The size and the homogeneity of the customers within each segment are heavily influenced by arbitrary rules — the rules inherent in building the segments are chosen without automation.
- The same three axes are always used (a strategy hard to use for segmenting by product, for instance).
- A relatively manual method, so a fairly long process for updating or rebuilding a segmentation.
To get round those flaws, we can use the following algorithmic model:
K-means
Clustering algorithms, of which K-means is one, allow effective segmentation — at least mathematically — into a number of segments chosen beforehand.
The data is then grouped so that the elements of one segment are more or less similar to each other, and different from the elements of the other segments.
To make good use of that in a business setting, the needs have to be defined clearly beforehand, so that the segments obtained can be put to work. To that end:
1. Identify the axes on which we wish to segment.
Example segments for a bicycle company:
By the kind of products they buy
- Mountain bike customers
- Electric bike customers
- Road bike customers
- Equipment & repair customers
- And so on
By amounts spent, purchase frequency and recency (RFM)
- VIP customers
- Active loyal customers
- Hibernating loyal customers
- Lost customers
- And so on
By the time of purchase or of visiting the site or shop
- Morning customers
- Evening customers
- Work-hours customers
- Night customers
- And so on
Many angles can be taken when segmenting. The axes of segmentation have to be chosen judiciously, however, so as to serve the objective set beforehand. For segmentation by product, for instance, we might consider suggesting different products by the segment the customer belongs to.
2. Set the number of segments.
Although mathematical methods exist for settling the optimal number of segments, the mathematical answer may not match the company’s needs.
If the aim of the segmentation is to write and send a different newsletter per segment, for instance, the number of segments must not be too large, or the writing would take too long. A balance has to be found between granularity and generalisation.
Example:
Here is a concrete case, using clustering to segment one of our clients’ customer base.
The company wanted to address each customer more personally, by the kind of purchase they had made. It wanted, for instance, to show a personalised home page by the customer’s preferences when they are logged in.
We therefore segmented the customer database using the k-means method, which let us identify, mathematically and automatically, four very distinct customer segments.
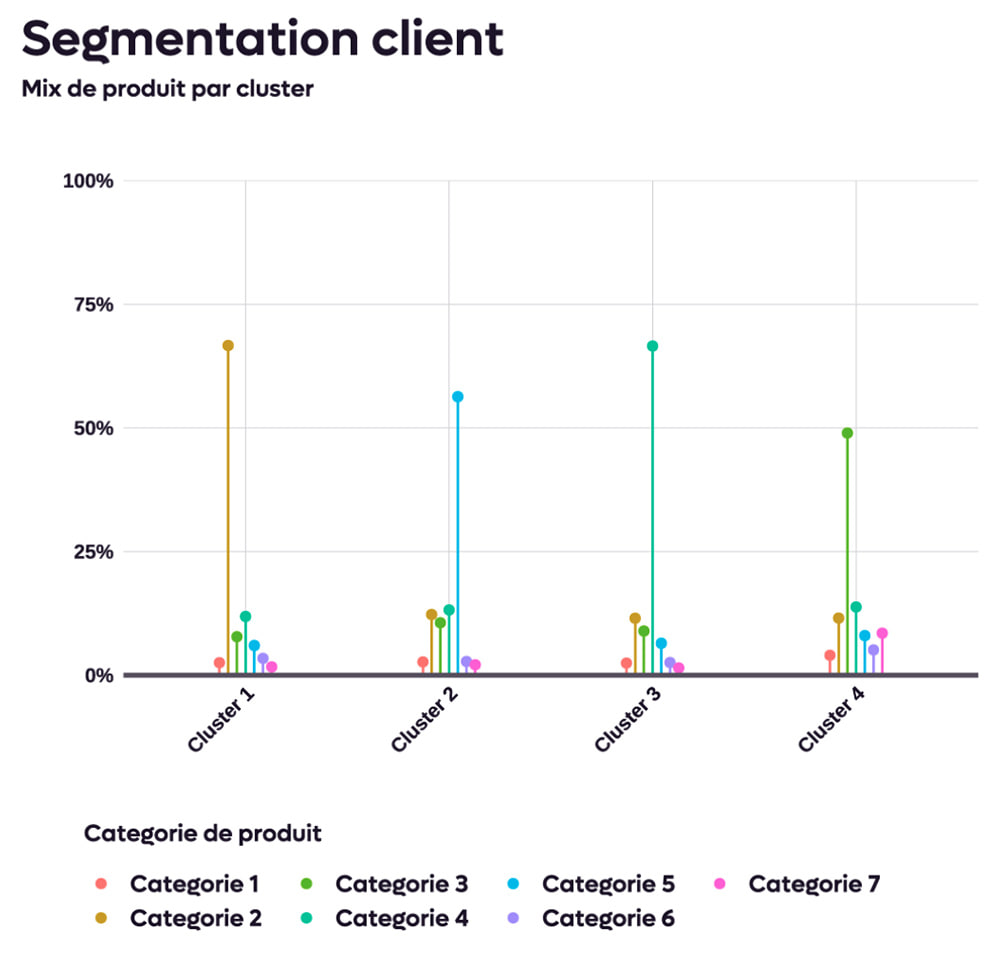
In the chart below we can see that the customers in each cluster have a marked preference for a single category of items and take little or no interest in the others.
Each cluster buys mostly one category: from 49% to 67% of its purchases
Share of each of the seven product categories in each cluster’s purchases, in %. A k-means segmentation into 4 clusters of the customer base of a bright client.
Source: the client case presented in the article; values read off its original figure (±1 point) · Chart: bright.swiss
The company therefore identifies buyers who are similar in their purchasing behaviour and places them in the same segment. It can then:
- Send them newsletters only for the products that interest them, so as not to overload them while staying relevant,
- Fit the customer experience on the site to the segment they belong to,
- Detect interactions between products and encourage cross-selling.
In the example above, segment 4 is strongly interested in product category 3. But looking more closely, category 7 is also bought almost exclusively by those same customers. There is an opportunity to cross-sell between product categories 3 and 7.
Find out which products are most successful with each group of customers (shown by the size of the segments),
In short, using segmentation in marketing lets customers be grouped effectively into clusters through similar characteristics. That lets companies target their marketing effort effectively and improve their campaigns. The segmentation methods most used today are fairly limited and manual. We therefore recommend k-means clustering, which is not only semi-automated but far more flexible, and opens the possibility of segmenting across a multitude of dimensions.
For the curious who want to learn more about the technical side of our clustering method, read on.
Technical aspects
The k-means clustering method mentioned above is defined as follows:
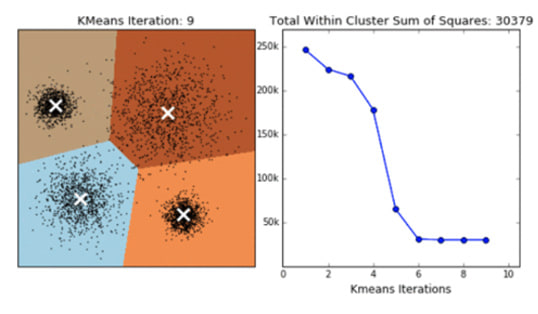
The algorithm works by iteration — that is, by moving each cluster centre (or centroid) towards the nearest data, until a stable state is reached and the elements no longer change cluster.
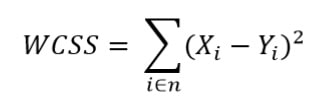
To set a cluster’s centroid, the least squares method can be used. It minimises the sum of the squared distances between the centroids and the points, which groups the data that is most similar mathematically.
We start by initialising each cluster’s centroid at random, then repeat the following steps until convergence:
On these 200 fictional points, k-means recovers the 4 groups: beyond that, inertia barely falls any further
A k-means simulator on 200 fictional points described by two criteria. Inertia (WCSS): the sum of the squared distances from each point to its cluster’s centroid.
The points and their centroids
Inertia (WCSS) per iteration
Final inertia against k
Segmentation obtenue
Source: fictional illustrative data, Bright, September 2026 · Chart: bright.swiss
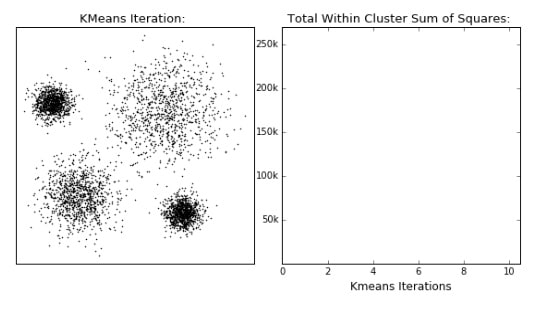
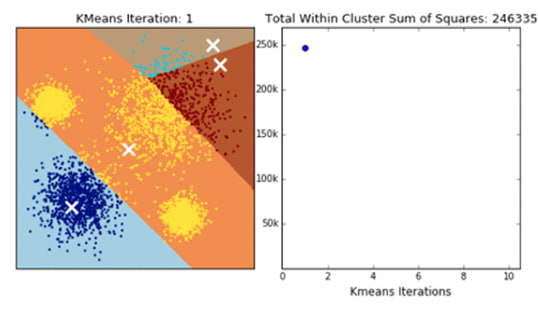
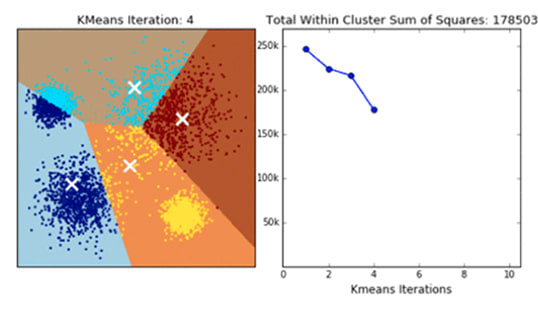
1. Each piece of data is assigned to the nearest centroid.
2. The centroids are updated — moved — so as to minimise the average distance of the data assigned to them.
3. The data is assigned once again to the nearest centroid, and the previous steps are repeated until a stable state is reached (the data no longer changes cluster).
The number of cluster centres is chosen by the user before running the algorithm, and depends on the structure of the data and on the aim of the analysis. It can, however, be complex to settle the optimal number beforehand, which is why the “elbow” method exists.
It consists of plotting the number of clusters on the x axis and the average distance of the data points from their respective cluster centres on the y axis. That gives an “elbow” curve, as in the chart below:
On these 200 fictional points, k-means recovers the 4 groups: beyond that, inertia barely falls any further
A k-means simulator on 200 fictional points described by two criteria. Inertia (WCSS): the sum of the squared distances from each point to its cluster’s centroid.
The points and their centroids
Inertia (WCSS) per iteration
Final inertia against k
Segmentation obtenue
Source: fictional illustrative data, Bright, September 2026 · Chart: bright.swiss
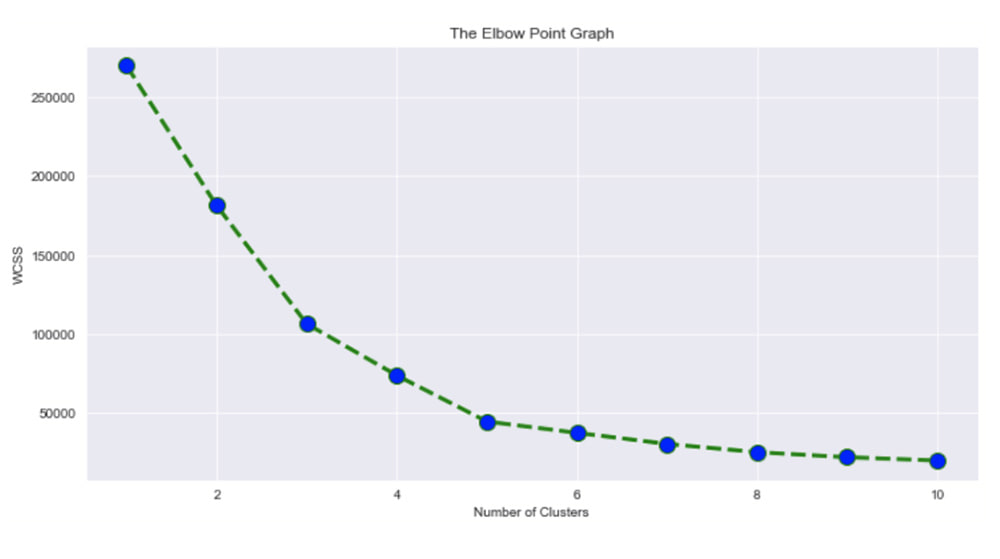
The optimal number of clusters is generally taken to be the one at the curve’s “elbow”. For a number of clusters below the elbow, the average distance of the data points from their cluster centres falls quickly, while above it that fall is less pronounced.
Note, however, that the elbow method is not infallible, and that its result depends on how the data is distributed. It is therefore recommended to check the results against other methods or indicators, so as to be sure the number of clusters chosen is sound.
Drawbacks
The negative points of the k-means clustering method are these:
Because it works by assigning data to its nearest cluster centre, it can group data in ways that are not optimal to an outside eye.
We can illustrate those problems with the image below:
k-means files each point with the nearest centre, not with the points of the same shape
Three sets of fictional points described by two criteria, and how k-means splits them.
Source: fictional illustrative data, Bright, September 2026 · Chart: bright.swiss
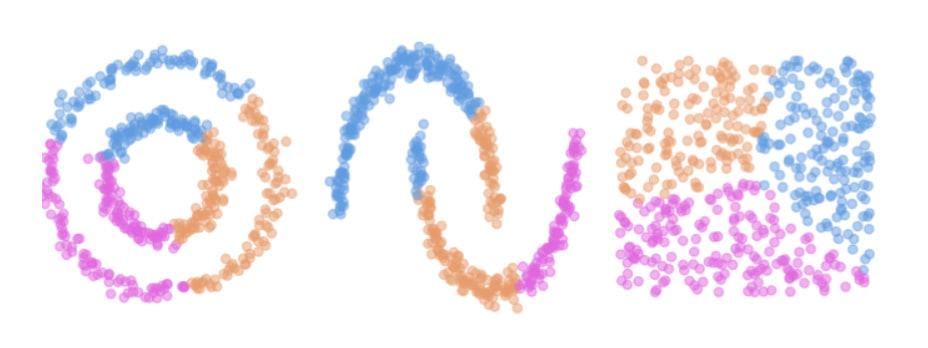
Although two segments are visually identifiable in the first two charts — data grouped as a small and a large circle, and data forming two arcs — we can see that is not the result the algorithm gives.
It simply creates groupings of the data that is closest, which makes little sense in those cases, as in the third, where there would be no logical reason to structure the data that way.
Among the other drawbacks: the need for particular software and advanced skills to put algorithms into production; a method of creating segments that is not very intuitive, especially with a large number of segments; and sometimes difficulty in interpreting the results and making use of them.
Going further
- CRM and segmentation2 publications
- Data science6 publications


The key skills bright can bring to you