


Looking at your revenue from several angles
Darko Macoritto
· 5 min
Broken down by cohort, revenue reveals how much it depends on past acquisition: acquisition has a limited effect in the short term and a far greater one in the long term, which helps set realistic objectives.
Swipe left to read
Keep reading
Broken down by cohort, revenue reveals how much it depends on past acquisition: acquisition has a limited effect in the short term and a far greater one in the long term, which helps set realistic objectives.
Introduction
Certain approaches to revenue analysis let you make better use of the information hidden within it. Highly relevant insight can emerge, once you manage to bring it to light. Some of it is remarkably useful for marketing analysis.
Before turning to these particular ways of representing revenue, let us first look at the classic way of watching it evolve. That overall view is shown in the chart below:
Overall view:
In 2022, 81% of revenue comes from customers acquired in earlier years
Annual revenue, in millions of CHF, from 2016 to 2022, by the year in which the customers made their first transaction.
Source: the article’s data, read off its three figures (±0.01 mio CHF) · Chart: bright.swiss
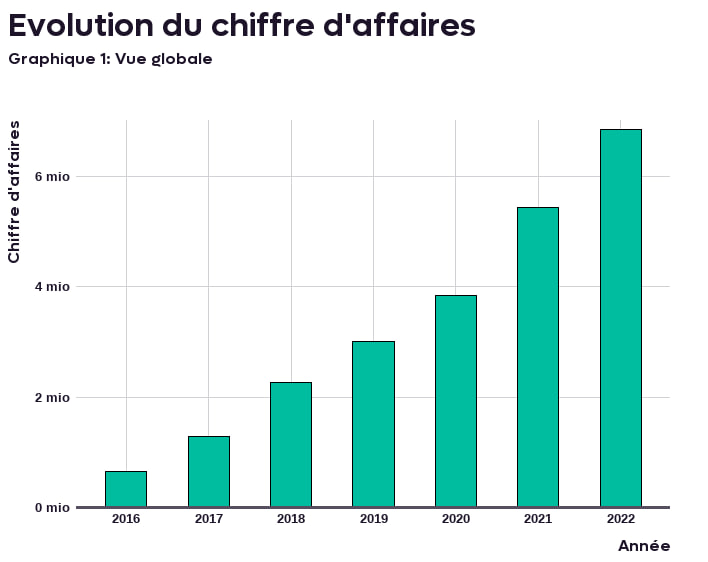
It is a general view, but from a marketing point of view, the main flaw of this angle is that it does not show all the elements of the revenue’s dynamics. We cannot know, for instance, whether revenue is rising because customer loyalty is high or because acquisition is performing. That makes it hard to make dependable predictions for the years ahead and to set realistic objectives.
The chart does nonetheless show that overall revenue is rising, which rather reflects the good health of the company observed.
View by cohort
We can, however, draw far more than a general trend. By revealing the components that hide, at first sight invisible, behind these simple bars, we can bring out insight that is very relevant to the business. Suppose we decide to analyse the revenue made each year by cohort, each cohort being all the customers acquired within one year. How revenue evolves then gives an understanding of customer loyalty, and lets us picture realistic growth scenarios for the years ahead.
To understand and illustrate what the evolution of revenue tells us, two charts seem to us particularly important, so as to identify where that revenue comes from and to draw sound conclusions.
In 2022, 81% of revenue comes from customers acquired in earlier years
Annual revenue, in millions of CHF, from 2016 to 2022, by the year in which the customers made their first transaction.
Source: the article’s data, read off its three figures (±0.01 mio CHF) · Chart: bright.swiss
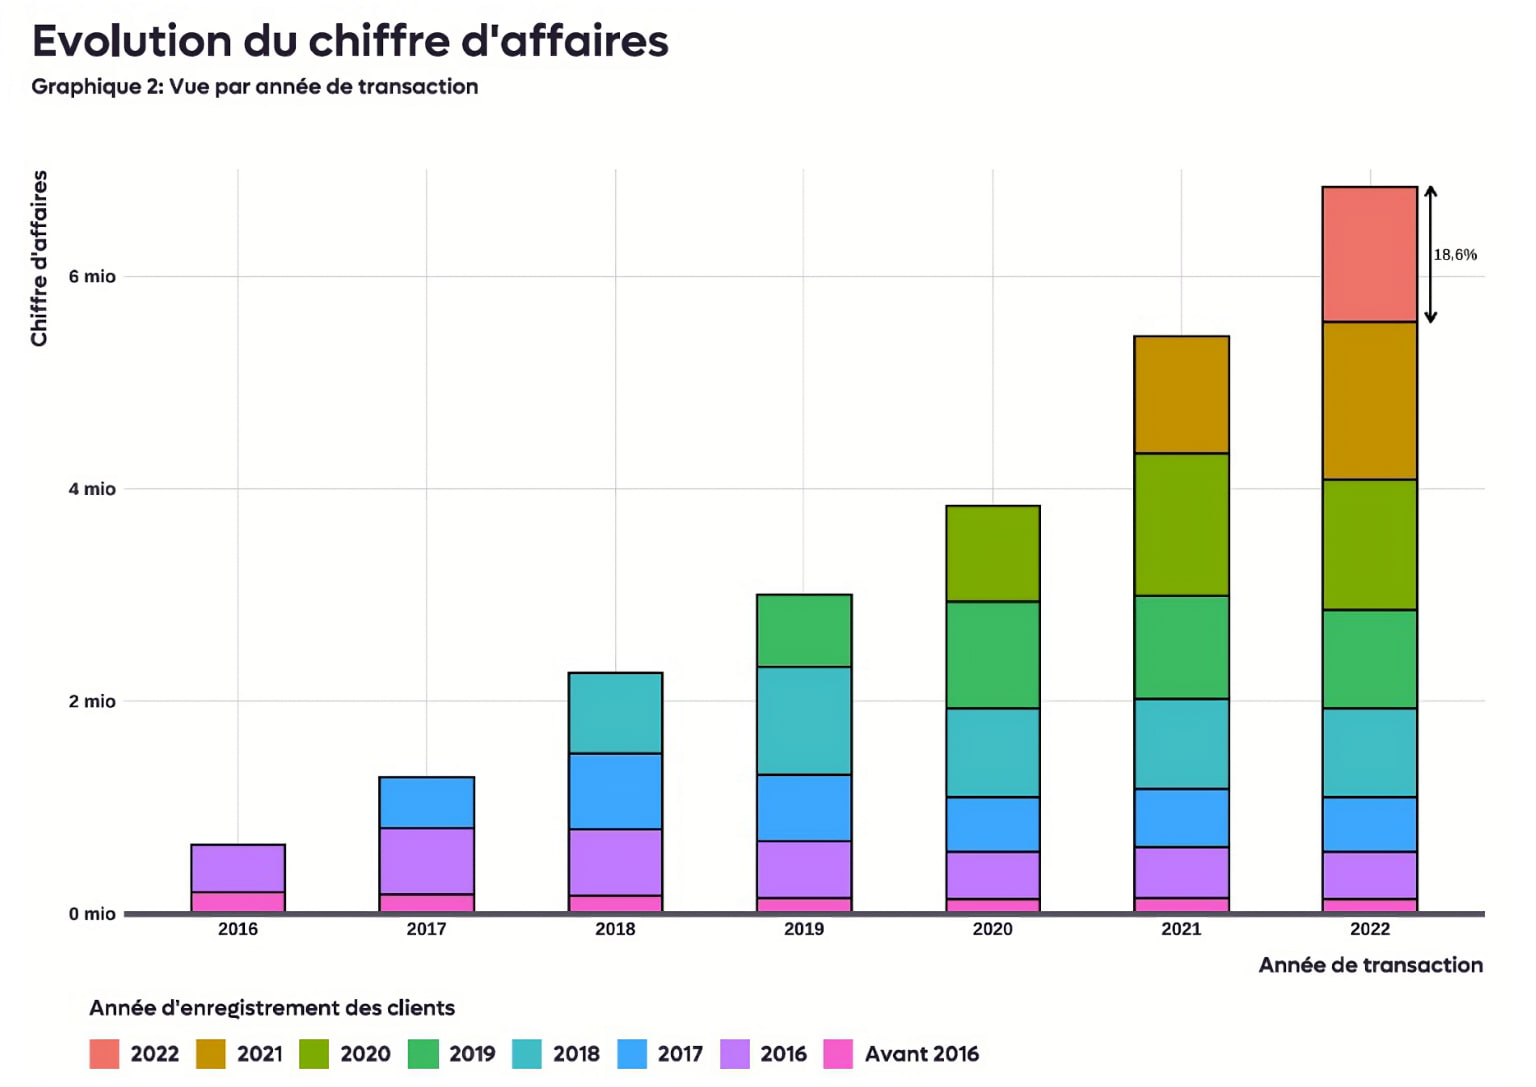
View of annual revenue, broken down by the year customers registered.
This chart shows the revenue generated each year. Its aim is to identify what each cohort of customers — grouped by the year of their first transaction — contributes to revenue over time.
That representation tells us where a given year’s revenue comes from. For 2022, 18.6% of revenue was made by the customers acquired that year. The rest came from customers acquired in previous years.
Important conclusions follow:
- Total revenue improves steadily year on year.
- Customers show long-term loyalty, since most of the 2022 revenue was generated by customers acquired earlier.
- The acquisition done today has an impact not only today but in the years ahead.
- A cohort’s largest annual contribution comes the year after it registers. That is because all those customers have a full year in which to transact. For example: customers acquired in December 2021 had only one month in which to transact, whereas they will have the whole of 2022.
View of revenue by the year customers registered, broken down by transaction year.
In 2022, 81% of revenue comes from customers acquired in earlier years
Annual revenue, in millions of CHF, from 2016 to 2022, by the year in which the customers made their first transaction.
Source: the article’s data, read off its three figures (±0.01 mio CHF) · Chart: bright.swiss
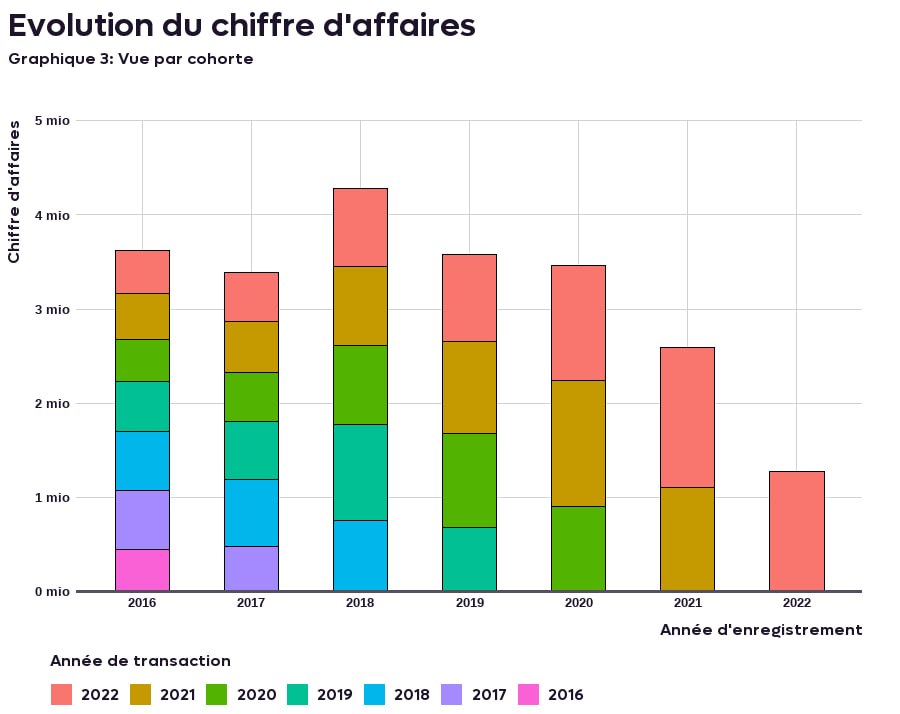
Here the chart gives a different view of the same data. The 2016 column is the total revenue of the customers who registered in 2016, broken down by the year in which they spent. In other words, the sum of the salmon volumes is the revenue generated during the year (2022), but spread across the corresponding year of customer acquisition.
The salmon part of the first column is therefore the contribution of customers acquired in 2016 to the revenue generated in 2022. The beige volumes are the revenue generated in 2021, the green ones in 2020, and so on.
You can see, for instance, that the customers acquired in 2016 generated a total revenue close to CHF 4 million between 2016 and 2022, and that it was generated more or less evenly across the years. That reflects a relatively low churn, in revenue terms.
In general, we can draw the following conclusions:
- A customer brings revenue over several years; their value over the medium and long term therefore has to be set against their cost of acquisition. This is where calculating lifetime value becomes interesting, since it establishes the maximum acquisition cost per customer. If you want to know more on the subject, read this article.
- The acquisition done today will bring considerable revenue in the years that follow. You therefore have to be aware that an investment made to acquire a customer may pay for itself after several years.
Analysis
Looking at revenue from these different angles also helps set realistic objectives for revenue growth.
As mentioned earlier, only 18.6% of the 2022 revenue comes from the acquisition done in 2022. That shows acquisition has a limited effect on revenue in the short term and a far greater one in the long term. The 2023 revenue will therefore also be generated largely by segments of customers acquired before 2023.
So if we decide to invest the marketing budget needed to double customer acquisition in 2023 against 2022, that will only raise revenue by 18.6%. This analysis puts the figures in perspective, and avoids disappointment should the company generate “only” an 18.6% rise that year — all the more so since that rise will be felt over many years.
Conclusion
Looking at revenue from different angles brings a better understanding of the dynamics at work, and of the dependence on past acquisition. It then becomes simpler to forecast revenue for the years ahead.
In the case set out above, there is a strong dependence on the past, which has the advantage of “securing” considerable revenue next year even if acquisition were to fall. Marketing mix modeling approaches the question from another angle: it isolates a “baseline”, the share of sales made whether or not you do any marketing.
Hence the importance of having a fitting CRM strategy and of monitoring certain KPIs such as lifetime value and the churn rate.
Going further
- Data science6 publications
- Marketing Mix Modeling10 publications


The key skills bright can bring to you