


Our omnichannel reattribution algorithm (MMM)
Damien Fournier
· 10 min
Measuring each channel’s effectiveness calls for a reattribution model that accounts for every media lever, digital or traditional. At a fixed budget, it lets you reallocate from a saturated channel to a less saturated one.
Swipe left to read
Keep reading
Measuring each channel’s effectiveness calls for a reattribution model that accounts for every media lever, digital or traditional. At a fixed budget, it lets you reallocate from a saturated channel to a less saturated one.
How do you measure the effectiveness of marketing channels?
Measuring a marketing campaign’s effectiveness is a decisive question for every advertising business. The multitude of marketing channels available today offers many possibilities, but it also creates more complexity.
So how can you be sure that every action taken is effective and profitable? How do you define the best marketing mix? How do consumers discover my company? Which advertisements reached them?
More than a century ago, John Wanamaker was already wondering about this:
– John Wanamaker (1838-1922)
Fundamental as they are, these questions remain current in 2022, and they pose a daily challenge for marketing experts.
Today’s algorithmic advances make it possible to bring some answers. We are convinced that data marketing is now the main vector of innovation in the advertising sector.
For us, the answer to the questions above lies in the ability to put in place a relevant and exhaustive reattribution model, one that accounts for every media lever, whether digital or traditional.
This article illustrates our methodology for putting an omnichannel reattribution model in place by exploiting algorithms.
Objective: a better allocation of marketing budgets.
First of all, the advertising campaign’s objective has to be defined: is its main purpose to make the brand known (awareness) or to increase the number of new customers (acquisition)?
Depending on the campaign’s purpose, the measurement techniques differ.
Awareness – The performance of awareness-oriented marketing campaigns is very hard to measure, particularly for offline media. They often have long-term impacts, and the KPIs that are relevant in that case (such as visits to the site) represent your campaign’s impact only partially.
Word of mouth remains complex to measure; spontaneous (or prompted) brand awareness, however, is an indicator that can be quantified through market studies, which specialist institutes can carry out.
Acquisition – For acquisition campaigns, on the other hand, focused on performance (that is, where the campaign’s objective is supposed to be measurable), there are methodologies of varying sophistication for estimating their impact. In the first place, the rise of digital has greatly helped in quantifying impacts.
Today almost every digital marketing platform gives access to dashboards that estimate the number of conversions their campaigns generated. Some major problems do nevertheless emerge from these techniques, for instance:
- Most of the algorithms used depend on tracking methods. Without going into detail, tracking can be lost in several commonly encountered scenarios — a change of device, the use of private browsing, or the constraints tied to data regulation (GDPR).
In that case, the impacts the platforms calculate can be markedly underestimated. - The methodologies differ from one platform to another, which in some cases makes comparisons unreliable and tends to favour the “optimistic” platforms.
- There is a risk of double counting when a customer passes through two marketing channels.
What is more, these impact estimates are available only for digital platforms. For offline, alternative solutions have to be found.
This article presents our overall solution for measuring the impact of all your marketing campaigns (online and offline). The aim is to evaluate the marketing channels individually and to adjust the budget for each channel, so as to arrive at a more effective allocation of resources.
The reattribution model.
Our objective is to put in place an algorithmic reattribution model that measures the impact of all acquisition activity, across every media lever, whether offline or digital.
Many academic researchers have developed various algorithms in recent years which, once assembled and integrated, make it possible to build an intelligent reattribution model. The results are then accurate and relevant enough to be used as decision-support tools, when building a media plan or simply to allocate marketing spend better.
The purpose of this attribution model is to determine each channel’s marketing impact, according to how that channel influences a chosen KPI. The KPI in question may be the number of new customers or the revenue, for instance.
The model’s strength is that it models a whole series of key elements that are indispensable to evaluating marketing channels properly. The main points taken into account are the following:
- Seasonality: the figures rise naturally depending on the time of year (before Christmas, for instance).
- Trend: assesses whether the business is growing or declining overall.
- Diminishing marginal effect: in theory, each additional franc spent performs less well than the previous one. From there, every marketing channel becomes marginally unprofitable at a certain level of spend.
- The lagged effect: an advertisement sometimes needs time before its effect unfolds in full. So the impact has to be estimated not only while the advertisement runs, but also over the following days and weeks.
- The mixing of marketing channels: if several channels are active at the same time, the effects accumulate and are sometimes hard to tell apart.
- Inclusion of external effects: marketing is not just a matter of serving advertisements through paid channels. Sending emails or holding events can strongly influence the company’s results. These elements can be taken into account in the modelling.
One of this algorithm’s strengths is that it applies the same impact-calculation methodology to every marketing channel, offline channels included.
The technical and mathematical side is not covered in this article. For more information we invite you to get in touch — we are genuinely passionate about it. Since then, Google has announced the integration into GA360 of its own open source model, Meridian: our reading of the announcement.
Results.
Depending on the case in hand and the aim pursued, the reattribution model will be used in slightly different ways. The case presented below studies how a multitude of marketing channels influences a company’s revenue.
This is a fictional example with fictional data, but it illustrates this algorithm’s usefulness perfectly.
In the example presented, all marketing spend and revenue over time were gathered over a long period (from November 2016 to November 2019), week by week.
One of the first interesting things is to visualise the spend by week, so as to detect anomalies or periods of intense marketing. It is vital that the marketing spend data be correct and verified, so that the model can do quality work.
From August to November, a third of the weeks carries half the spend
Media spend per week, in CHF, from 7 January to 11 November 2019, across the company’s five channels. Choose a view or a channel; hover a week for the detail.
Source: the article’s fictional example (bright’s reattribution model); values read pixel by pixel from its original figure, approximate · Chart: bright.swiss
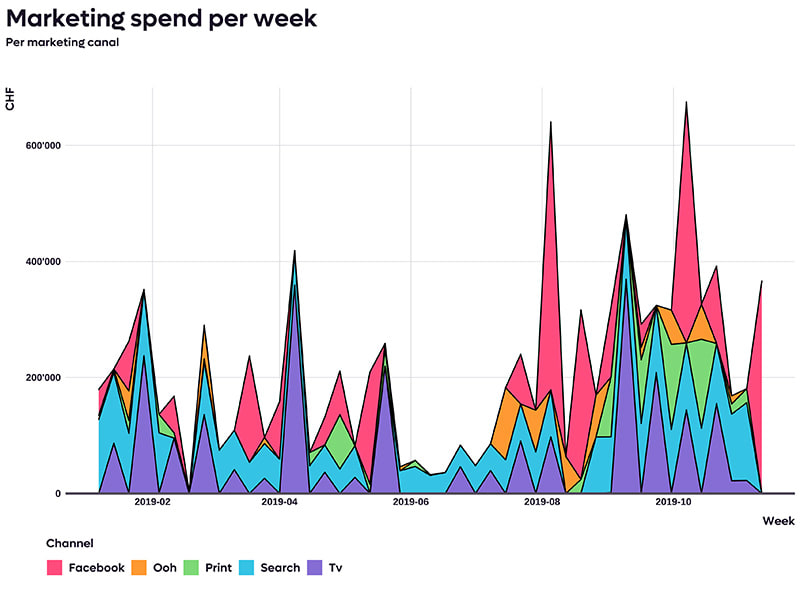
An illustration of the marketing spend committed by the company over 2019.
Above, the marketing spend committed by the company over 2019. We can see fairly clearly that spend is heavier at the end of the year and that a quiet period falls in the middle of the year (June/July). We can also see that the company has a marketing strategy resting on both online and offline channels. It is active on five different marketing channels, two of them online.
Once the modelling has taken place, the results can be visualised in several ways. Below are the most relevant charts, along with the use we make of them.
86.57% of sales happen without marketing; TV leads the remaining 13.43%
Each element’s contribution to revenue as estimated by the model, from November 2016 to November 2019, in millions of CHF and as a share of the total. Zoom in to compare the channels with each other.
Source: the article’s fictional example (bright’s reattribution model), values labelled on its original figure · Chart: bright.swiss
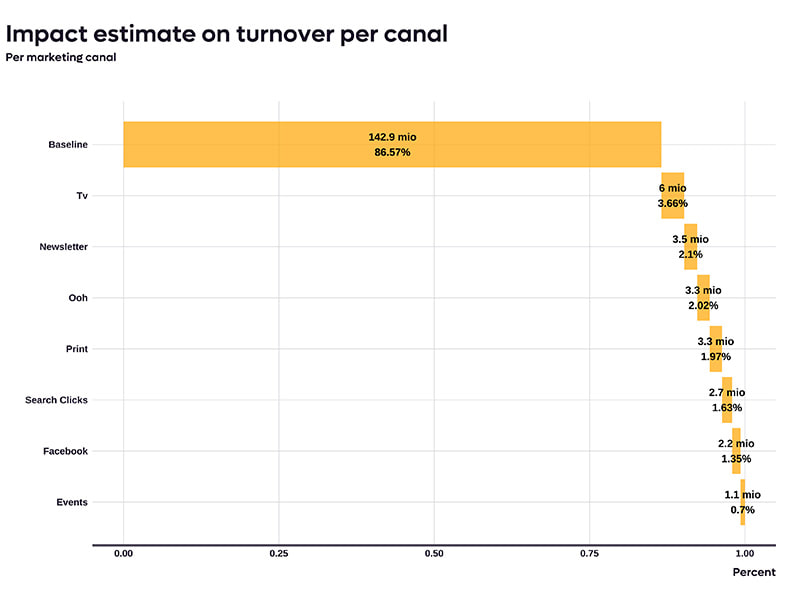
The waterfall chart lets us visualise the individual effect of every element fed into the model over the period analysed (that is, from November 2016 to November 2019).
It is vital to note that part of the sales happens naturally (that is, whether or not you do any marketing). That base of customers is called the baseline. They are often customers who already know you, who have seen your shop, who have heard of you, and so on. We can see clearly on this chart that the baseline accounts for 86.57% of total revenue — the great majority of sales. The remaining revenue, 13.43%, is generated by the marketing channels and by the activity the company carries out, such as events and sending the newsletter.
This way we can establish the impact by marketing channel, but not yet compare it with the costs those channels incurred.
Print: 8.48% of the spend, 18.55% of the effect, and the only ROI above 1
Each paid channel’s share of media spend and of the effect on the paid channels’ revenue, in %, from November 2016 to November 2019, and each channel’s ROI, in CHF of revenue per CHF spent.
Share of spend Share of effect
Source: the article’s fictional example (bright’s reattribution model), values labelled on its original figure · Chart: bright.swiss
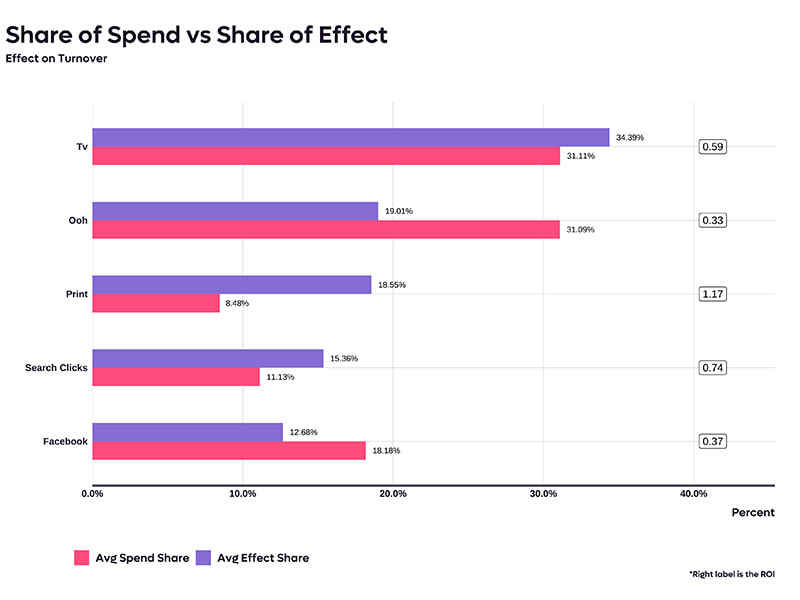
This chart is highly informative, because it shows the share of total spend committed by each channel as well as each channel’s effect on revenue (the total being the total revenue generated by the paid marketing channels). The label on the right equals the ROI — that is, how much revenue one franc spent on marketing brings in.
The channels with the greatest impact are not necessarily the most effective ones. TV, for instance, has a large relative effect (34.39%), largely because its spend was substantial. ROI serves as the indicator of effectiveness: the higher it is, the more profitable the channel. This chart also gives indications about the optimal level of investment. Generally speaking, if the average share of spend is larger than the average share of effect, investment in that channel is in all likelihood above its optimal level. In those conditions, the marginal effect of an additional franc will probably be smaller than 1.
In the present case only print seems to have been profitable over the period analysed (as it is the only ROI > 1). That does not mean every other channel should be stopped, but rather that the other channels were probably over-invested.
The “Events” and “Newsletter” variables are not included in this chart, because they involve no media spend. So the cost considered is zero for those variables.
TV and OOH stretch their effect the furthest, print the least
Lagged effect (adstock) estimated for each channel, from November 2016 to November 2019: the share of one week’s effect that still acts the following week, in %. Choose a channel to follow CHF 100 invested, week after week.
Lagged effect (% from one week to the next)
Effect of CHF 100 invested (CHF, per week)
Source: the article’s fictional example (bright’s reattribution model), rates labelled on its original figure; the week-by-week effect calculated as the article describes it (each week, the rate applied to the previous week’s effect) · Chart: bright.swiss
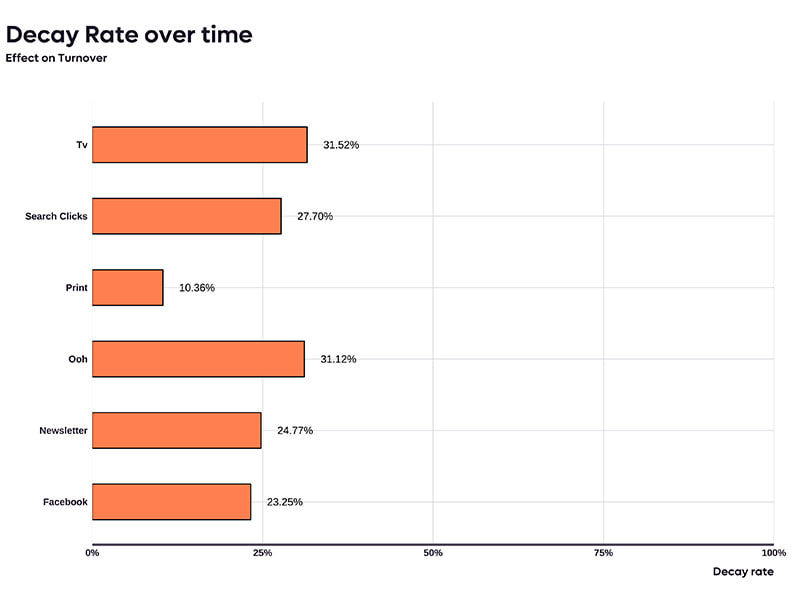
As explained above, this algorithm takes a lagged effect into account. That is, it evaluates each channel individually in order to know whether it has an impact not only while it runs, but also in the weeks that follow.
For instance, TV’s lagged effect is 31.52%. That implies that if we invest CHF 100 of TV spend in one week, those CHF 100 will also have an impact in the following weeks. The week after the advertisement runs, the CHF 100 invested will have a lagged effect equivalent to CHF 31.52. Two weeks after it runs, the CHF 100 invested will have a lagged effect equivalent to CHF 9.9 (that is, 31.52% of the previous week’s effect), and so on. A franc’s effect “dies” little by little over time.
As the chart shows, every channel has its own lagged effect. Print, for instance, has a markedly less persistent effect over time than TV (but that does not mean it performs less well).
At the average budget, only print still brings back more than a franc per franc added
Revenue estimated by the model against each channel’s weekly spend, in thousands of CHF. The dots mark each channel’s average spend; the blue ring, the tipping point, where one more franc brings back exactly one franc. Choose a channel, then move the spend.
Source: bright’s reattribution model as presented in the article; curves read off its original figure, approximate values · Chart: bright.swiss
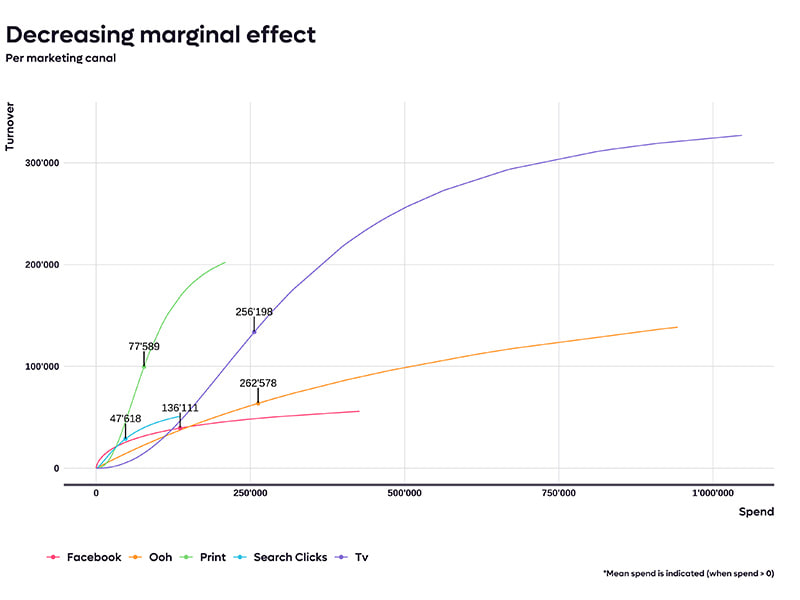
The chart above is, in our view, the most useful for optimising a marketing budget as well as possible. When too much spend is committed to a marketing channel, that channel tends to saturate (which is explained by the diminishing marginal effect). At that point an additional franc invested generates less than a franc, and the channel is no longer profitable. From there, spend on that channel has to be reduced in order to try to find the point where the channel is profitable again (the tipping point being where an additional franc earns us exactly one franc).
To optimise revenue (the KPI chosen in this case), you would theoretically have to sit at every channel’s tipping point. The whole art is therefore to find where the tipping point lies for each marketing channel, if it exists at all.
On the chart above we can see that the curves’ slopes tend to flatten the higher the level of spend (theoretically that should be the case for every channel). The flatter the curve, the more saturated the channel, because the marketing spend is too heavy over too short a period. The points give an indication of where we stand on each channel.
So, for a fixed budget, it pays to reallocate budget from a saturated channel to a less saturated one. Reducing the Facebook budget and reallocating it to print, for instance, is a budget-neutral operation, yet it achieves better overall revenue. For La Redoute Suisse, modelling of this kind made it possible to reallocate the budget towards the under-invested channels.
Uses & conclusion.
The results of these analyses bring real added value, because the actions we can put in place are no longer driven by intuition alone but justified by concrete facts.
These analyses bring a logical view, complementary to the intuition that comes from the marketing teams’ experience. Rather than clashing, the two reinforce each other to become a precious tool for future decisions — informed decisions, guided by the same intent: the performance and profitability of marketing activity.
We put our attribution model to work to steer the marketing activity we carry out for our start-ups and our clients.
That way we can:
- Better understand how those revenue sources are made up, and which levers are capable of bringing growth.
- Set coherent growth objectives against the various media levers.
- Identify the under-exploited opportunities and stop the activity judged unprofitable.
- And above all, propose an omnichannel media plan that sizes the right budget for each lever, and so raise the return on investment and growth while keeping the budget available unchanged. Where applicable, after the media plan has been optimised, if a lever remains under-exploited, we can justify raising the media budget as a whole.
We put this model to work for many clients. We often find that the volume of data needed to feed the algorithms is sufficient. Sometimes the challenge is having a precisely documented dataset. That is why the first step when setting up our Data Science programme is to audit the existing data, so as to propose, where applicable, a methodical data collection project that lets every company hold the right data for the reattribution model in the short term.
The series : MMM explained in three chapters
- Marketing Mix Modeling10 publications
The key skills bright can bring to you