


Building a marketing data warehouse
Darko Macoritto
· 5 min
Manual analysis quickly reaches its limits. By centralising the data, a marketing data warehouse lets you assess the real ROI of every action, and steer your investment on evidence rather than intuition.
Swipe left to read
Keep reading
Manual analysis quickly reaches its limits. By centralising the data, a marketing data warehouse lets you assess the real ROI of every action, and steer your investment on evidence rather than intuition.
Introduction.
As a company grows, the complexity of its processes, of the tools it uses and of its organisation inevitably rises. Past a certain point, analysis based on manual exports becomes laborious and hard to carry out, for several reasons:
-
- The number of exports needed for a single analysis rises, as more and more different tools are used.
- The analyses grow more complicated as the processes themselves grow more complex.
- The volume of analysis to carry out naturally rises with the company’s growth.
- The risk of errors tied to a lack of documentation rises empirically.
To automate those analyses — or at least a large part of them — putting a data architecture fitted to the needs in place becomes a sound solution. There are many approaches and solutions on the market for doing so. We will present one we believe sound, and which we are used to deploying for our clients.
The advantages of a data architecture.
Among the great benefits that follow from putting a data architecture in place:
- Better data dependability: a single source of data (BigQuery, for instance) will be used for the great majority of dashboards, which considerably strengthens the coherence and dependability of the information. A precise base on which to strengthen attribution.
- Professionalising data management: the storage and processing of data will be centralised around a dedicated owner. That centralisation makes for better coherence in the analyses and in the conclusions drawn from them.
- Speed: automating the analyses allows fast, regular processing, updated without human intervention.
- New analytical capabilities: bringing multiple data sources together within a unified architecture lets new indicators be built, usable in real time in reporting solutions or through an API.
An illustration.
Picture a company facing this kind of conversion funnel:
One customer journey, four tools: as many exports to reconcile by hand
A prospect’s journey in the article’s example, from the advertisement to the signed offer: each step leaves its data in a different tool. Hover, tap or step through a stage with the keyboard to read it.
Source: Bright, “Integrating a marketing data warehouse”, October 2025; diagram redrawn from the article’s figure · Chart: bright.swiss

- Someone interested by the advertising on Meta generates a lead on Facebook.
- The lead is called back by telephone. At this stage the aim is to build trust and to pin down the potential customer’s needs.
- If the customer is interested, an offer is sent by email, with a DocuSign link to sign it.
- The offer is signed electronically on DocuSign.
That workflow, simple and realistic, nonetheless calls on four different tools. To analyse the customer journey by hand, you therefore have to reconcile at least four data exports. While that can be done occasionally, the task quickly becomes heavy and time-consuming if it has to be repeated regularly.
Yet the marketing team needs to follow the number of signed offers continuously, so as to steer the advertising investment and identify the best-performing campaigns.
The sales team, for its part, has to be able to measure the percentage of emails that lead to a signature, and the number of calls needed to close an offer. The finance team has to control the costs the various tools incur, and so on.
Without automation, that information is not available in time, which leaves the teams working blind and often means considerable money left on the table.
The solution.
Putting a data architecture in place aims to “industrialise and standardise” the analysis process, so as to secure the dependability of the data and the soundness of the conclusions drawn from it.
A complete data architecture is generally structured around four main components:
- Sources: identifying all the data you wish to collect. In our example, that means the four tools mentioned above.
- Data warehouse: the central solution where all the data collected from the various sources is stored, centralised and kept over time.
- Transformer: at this stage, the raw data is processed, reconciled, aggregated and enriched, so as to produce relevant, usable indicators (KPIs).
- Visualise: the results are then presented through a business intelligence tool (such as Looker Studio), letting the teams follow their indicators.
Two further components play a key part in the smoothness and dependability of that architecture:
- Pipelines: the mechanisms that carry the data from the sources to the data warehouse. For standard tools (such as Meta) there are pre-built connectors. For more specific sources, however, it is sometimes necessary to develop and maintain your own pipelines, which can be more complex and time-consuming.
- Orchestrator: the orchestrator is the tool that coordinates the whole process, notably by automating the data refresh at regular intervals, so as to make sure the dashboards always show up-to-date information.
From the sources to the dashboards, the data flows with no manual export
The marketing data warehouse architecture Bright deploys for its clients: four components in a chain, linked by pipelines and coordinated by year orchestrator. Hover, tap or step through a block with the keyboard to read its role.
Source: Bright, “Integrating a marketing data warehouse”, October 2025; diagram redrawn from the article’s figure · Chart: bright.swiss
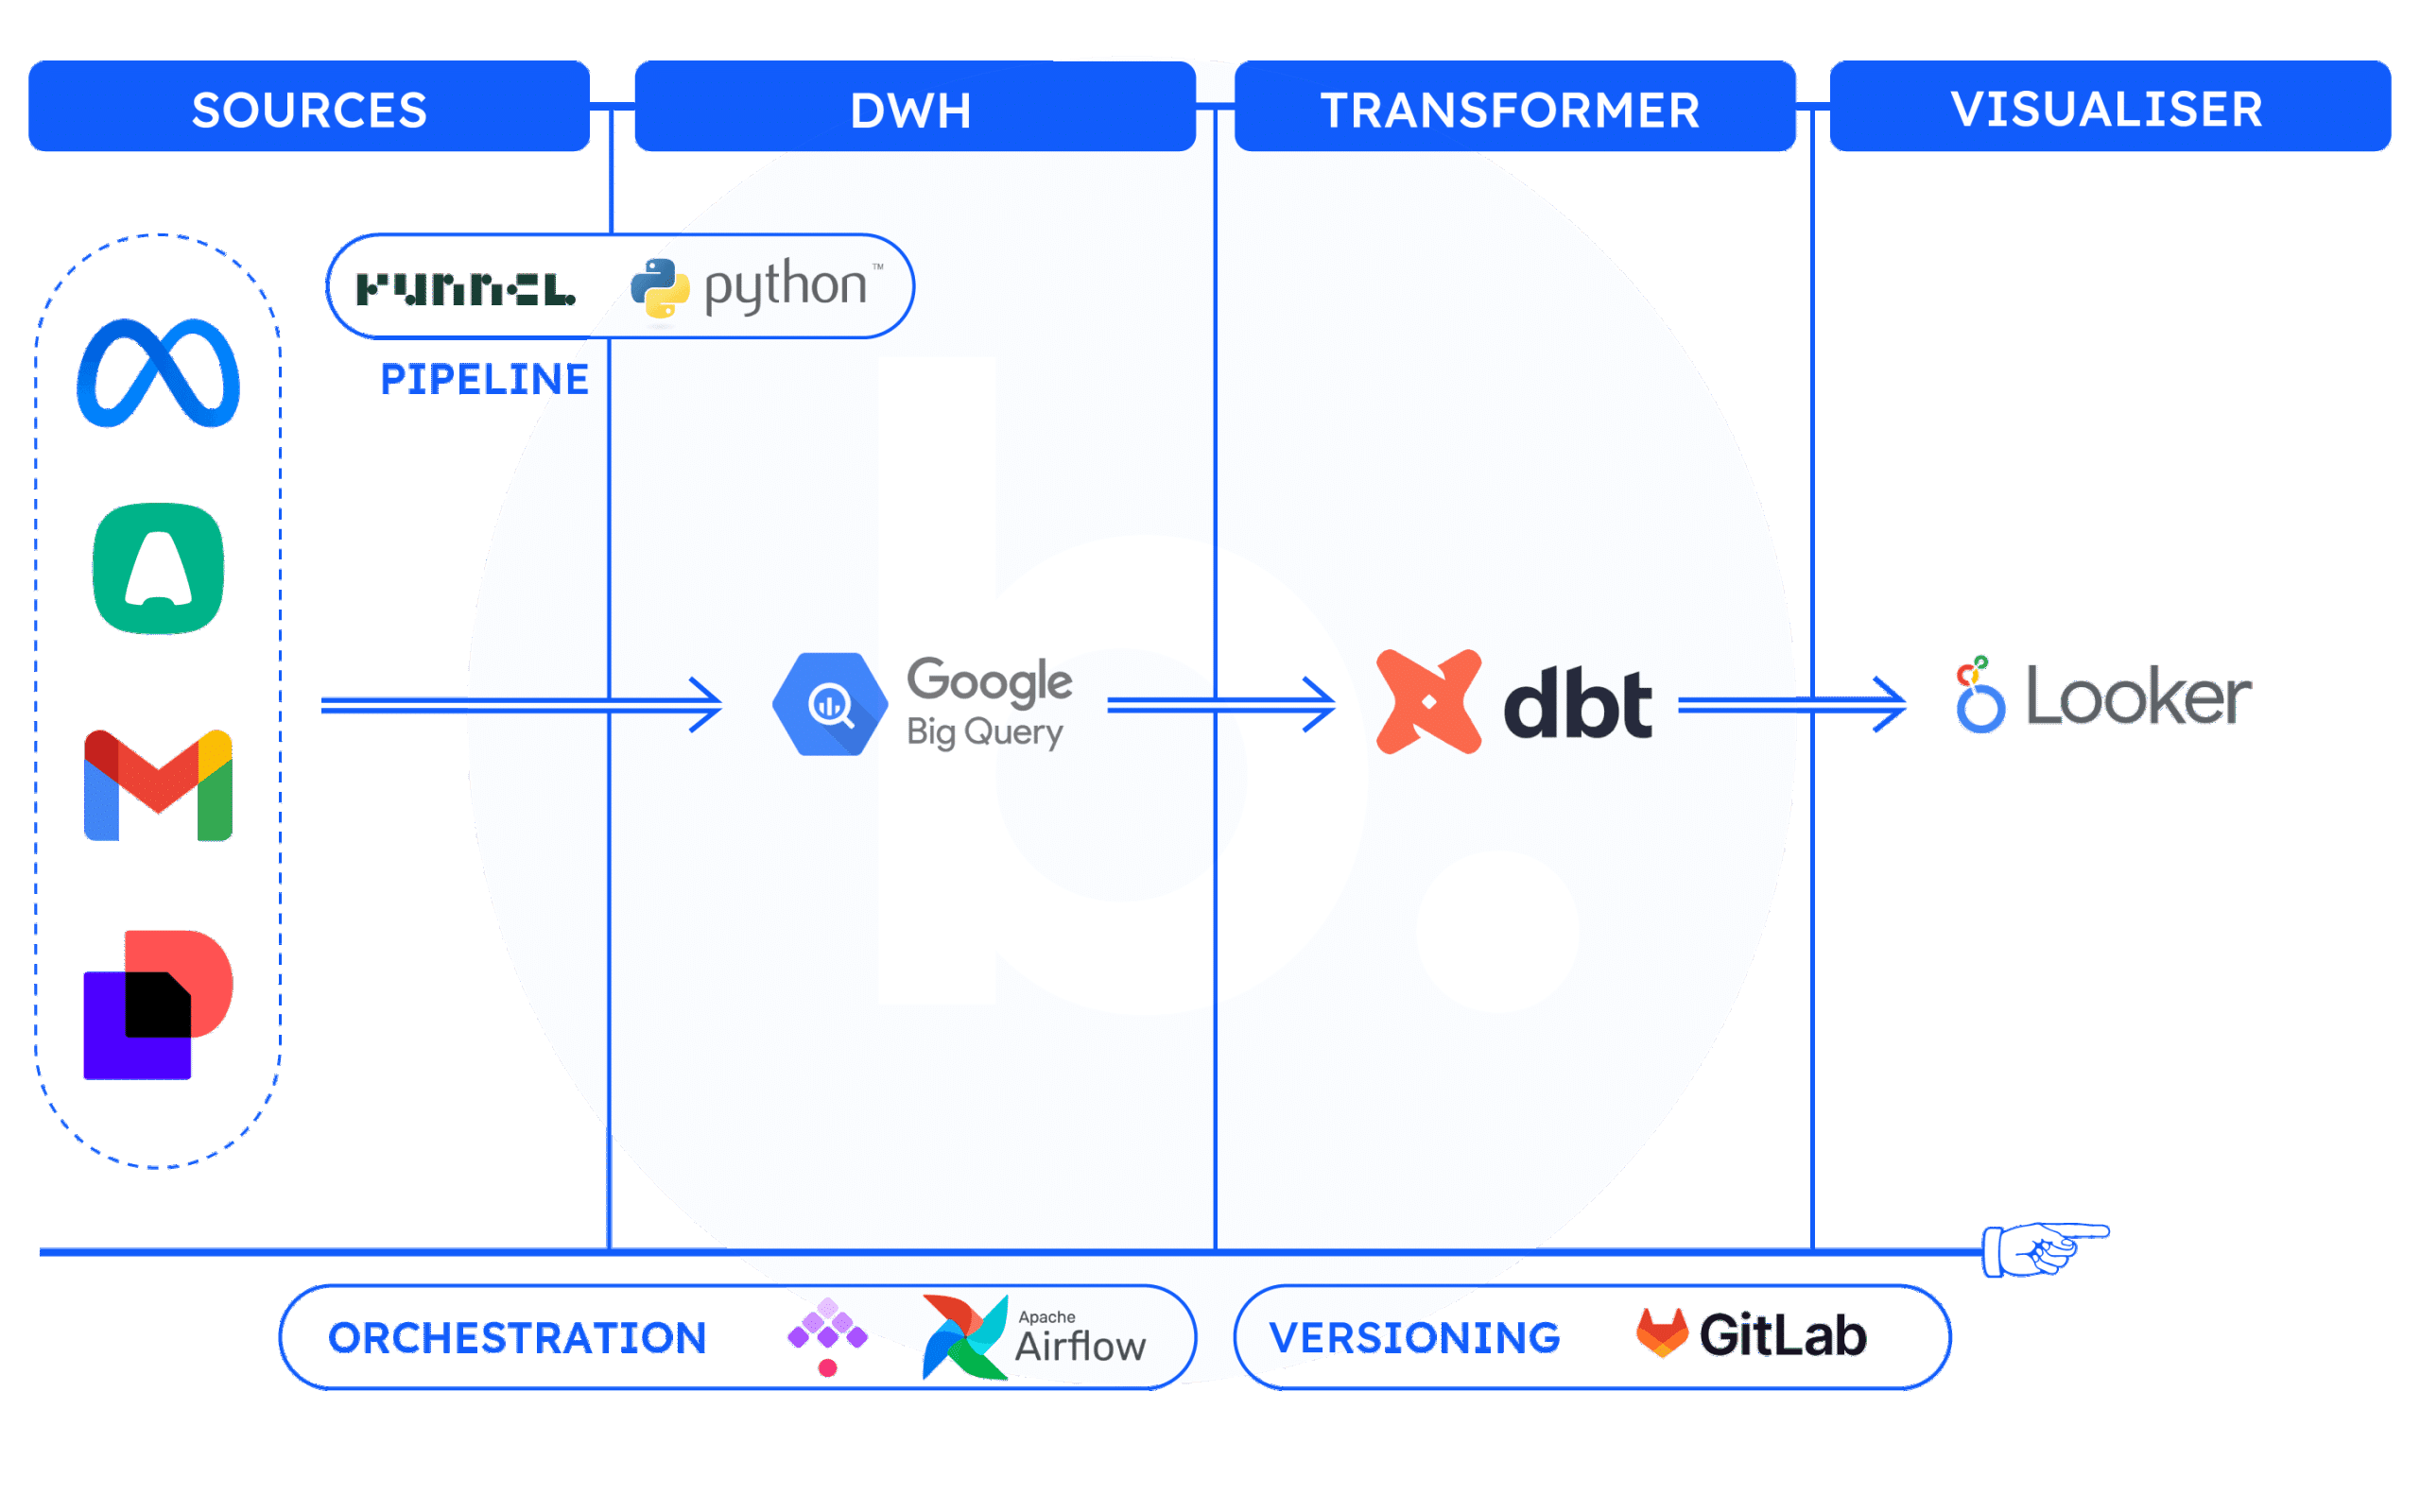
Diagram of a modular marketing data warehouse architecture, showing several expert solutions connected through APIs.
To be.
To return to our earlier example, once the data architecture is in place, the various teams will have access to refreshed data when they arrive at work, at 8am.
Each team will have its own dashboards and KPIs through the business intelligence solution (Looker Studio), fed automatically and updated regularly. Where needed — additions or changes — the data owner will bring the necessary developments into the existing workflow. Once in production, the new analyses will be available without disturbing the rest of the system.
At that point the teams have the right information, at the right moment, to make informed and effective business decisions. At Retraites Populaires, it is a connected data warehouse that lets the campaigns gathered in the Cube be steered continuously.
Among the analyses we could carry out in that setting, we might consider:
- Measuring the quantity and the quality of the leads that marketing generates.
- Visualising the conversion funnel, so as to identify any bottlenecks or significant drops at certain stages.
- Analysing the time to conversion between the first click and the signature of the contract.
- Assessing the response rate to email campaigns.
Conclusion.
A robust data architecture is essential to any company that wants to grow while making full use of digital tools. Dependable data is indispensable to sound business decisions, which calls for an analysis process that is rigorous and coherent over time. Manual analysis, useful as it is in the short term, quickly reaches its limits. Only an automated approach can secure the dependability, the durability and the scalability of analysis at scale.
In short, putting a marketing data warehouse in place opens the way to a finer, more objective measurement of performance. By centralising the data and applying advanced attribution models — through to Marketing Mix Modeling — teams can at last assess the real ROI of every action and steer their investment on evidence, not intuition. Google has since announced the migration of Data Manager into GA360: one more brick in this kind of architecture, which does not replace the work on sources and pipelines.
Going further
- Tracking and data collection8 publications



The key skills bright can bring to you