

Data analysis to lift customer satisfaction.
Putting algorithmic segmentation in place.
Determining the factors that drive the NPS of each store.
- Period
- 2023
- Services
- K-means clustering
- Segmentation
- NPS
- Client
- Aligro
ALIGRO is a family-owned, Swiss and independent company, which opened the country’s first cash-and-carry market in 1966. It employs more than 1,000 people today across 14 stores in French-speaking and German-speaking Switzerland, and offers a range of food unmatched in Switzerland at very keen prices.
Challenge - Identifying the satisfaction criteria that matter most to ALIGRO’s trade customers.
ALIGRO wants to stay at the forefront of customer service. This year, to identify where that service could improve, the brand ran a thorough survey measuring the quality of what it delivers and how satisfied its trade customers are. The online questionnaire drew a high response rate, gathering the views of 2,000 customers.
The objective now is to make all that data speak, and to draw convictions and concrete actions from it.
Following the analysis, an action plan targeting whatever generates the most satisfaction will be built and put in place, so as to raise satisfaction among trade customers.
The analysis of the questionnaire centres on two questions:
Defining the right criteria.
Which criteria matter most to ALIGRO’s trade customers?
Project roadmap.
Once identified, which are the elements where ALIGRO must hold its level of service, and which must improve?
Strategy - Understanding how customer satisfaction is shaped by the characteristics of each store.
To do that, we analysed what moved the NPS. Factors that can move ALIGRO’s NPS include:
- The prices charged
- Customer service
- Product availability
- The range on offer
- And so on
The NPS (Net Promoter Score) is a satisfaction measure recognised as more precise than broader questions about satisfaction. In this case, the question was:
How likely are you to recommend ALIGRO to someone close to you (on a scale of 0 to 10)?
The analysis was split in two:
- A correlation study between the questionnaire answers and the NPS.
- The creation of customer clusters, to detect typical profiles of satisfied and dissatisfied customers.
The first part of the study, rather descriptive, showed which answers correlate most with the NPS. That analysis was run overall, by language region and by store.
It was striking to see that the drivers of satisfaction can differ from one store to the next. Granularity at store level gives ALIGRO what it needs to put differentiated satisfaction strategies in place, each fitted to that store’s own needs.
The second part of the analysis, more technical, consisted of creating clusters — segments — of customers and examining their profiles.
The clusters are built on customer satisfaction. Customers who answered in a relatively similar way are assigned to the same cluster — those who are very satisfied with everything, for instance. Since customers answered a great many questions, building the clusters by hand would be practically impossible. An algorithm builds them for us.
Store 3 holds 16% of the most satisfied customers, store 19 barely 2%
Share of each segment’s customers who shop at each of the 14 stores, in %. Algorithmic segmentation of ALIGRO’s trade customers into 4 segments, by their answers to the 2023 satisfaction survey. Choose a segment.
Each line is a store; each dot, the share of a segment’s customers who shop there. A segment’s shares add up to 100% across the 14 stores. In blue, the chosen segment; in grey, the other three.
Source: ALIGRO satisfaction survey of its trade customers, 2023; segmentation by Bright; values read off the original figure, approximate (±0.1 point) · Chart: bright.swiss
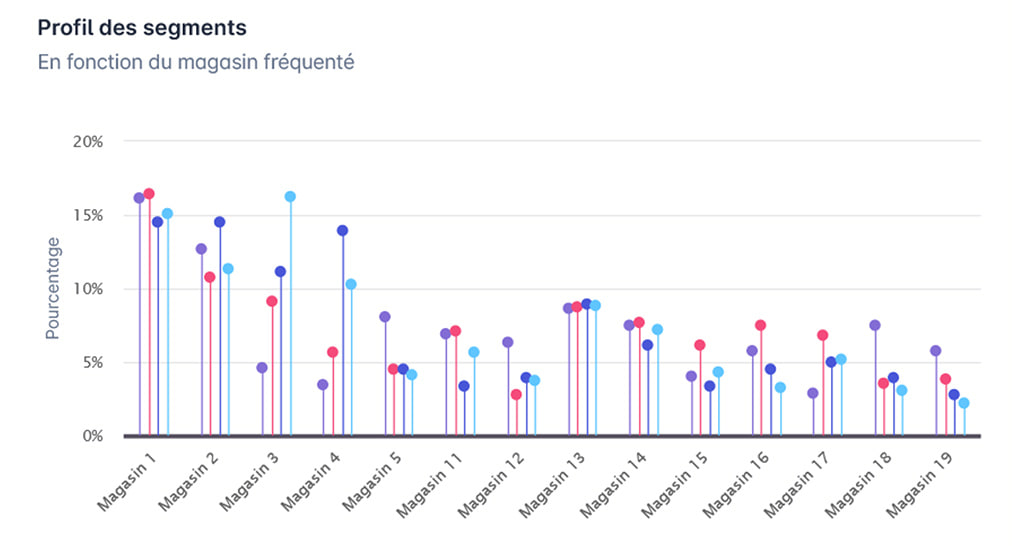
In ALIGRO’s case, we created four segments. Each has its own characteristics. Segment 4, for example, holds the most satisfied customers.
The chart above shows that very satisfied customers (segment 4) are over-represented in store 3, while they are scarcer in store 19.
Thanks to the first part of the analysis, ALIGRO knows which factors matter most to improve for store 19, and can therefore act on that store specifically. In the same way, it can understand why store 3 performs so well, and hold on to the services that matter most to its customers.
This survey study identified what is at stake in satisfaction, and set out a method for developing an action plan at several levels of granularity.
Impact
Once our analyses were delivered, ALIGRO’s marketing team was able to draw the lessons together and build a project roadmap for 2024.

The data analysis project ran very smoothly. The team showed a good grasp of the question and of the context, and a real commitment to bringing us concrete answers. The conclusions of their correlation analysis and of their cluster approach made it possible to present actionable results. On that basis, we are able to set a roadmap guided by the data gathered from our customers. It is extremely useful for our company.