The Lifetime Value of your customers (LTV) is an essential metric that allows you to define how much you can spend to attract a client while remaining profitable. But did you know how to compute it? This article explains step by step how to do it !
Definition and importance
The lifetime value (LTV) is a prediction of the net profit attributed to the future relationship with a customer. We, at bright, use the following formula to calculate the LTV for a specific customer i :

where t is a period
To keep this article simple, we propose to let the discount rate aside and to set it equal to 0. Therefore, the LTV for a specific customer is equal to their cumulated margin over T periods. When setting T = ∞, we obtain the lifetime value over the entire future relationship with a customer, which we call full LTV. In the literature, the term LTV usually designates what is called full LTV in this article.
In practice, we also calculate the average LTV for a group of customers i = 1, 2, …, I after T periods which is translated mathematically as follows:

The average LTV is important since it tells us how much, on average, a customer of the defined group is worth after T periods. When setting T = ∞, we obtain what we call the full average LTV.
As a rule, we consider the gross margin when calculating any LTV. It is equal to the revenue minus all direct costs. We do not subtract the fixed costs such as renting or staff costs. Marginally, an order does not increase fixed costs but does increase direct costs. Therefore, fixed costs must not be considered when deciding whether carrying out an additional order is profitable or not.
LTV is a key metric in marketing and should never be disregarded as it represents an upper limit on spending to acquire a new customer. Understanding the LTV of your customers is essential as it allows you to optimise your marketing campaigns and to maximise your company’s profit. A complete walk-through on profit optimisation is available here (in French).
Calculating the average LTV for a cohort
Firstly, you must define what a cohort is made of. A cohort is a group of people with one or many common characteristics. For our following LTV calculations, a cohort is defined by all the customers you acquired/who registered within a specific period of time (in more advanced analyses, you could segment customers according to additional criteria. Example: customers acquired within a specific period of time and through a specific marketing channel). Months or years are common units, but you may choose a different one depending on your business structure and preferences. In this article we have chosen years.
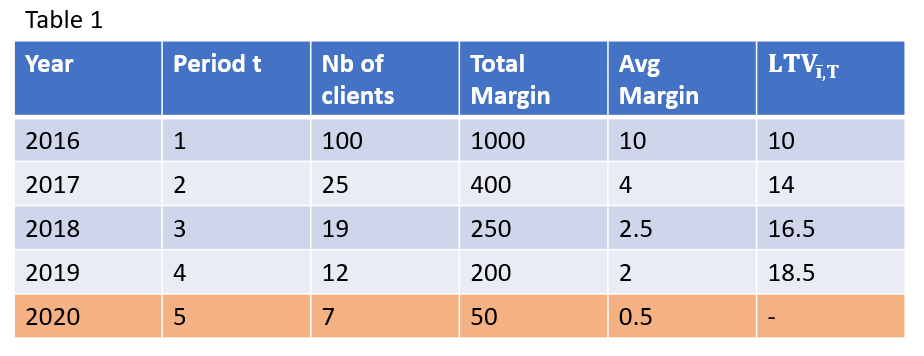
We start with a simple example. Let us assume we acquired 100 customers on January 1st, 2016 and we want to know their average lifetime value after five years (LTV5). Table 1 details the evolution in spend of this cohort.

Please note that from 2017 on, the customers generating revenues are exclusively returning customers. We also notice that the number of customers who made a purchase strongly decreases after the first period. Indeed, in most non-contractual businesses the average customer orders only once and the churn rate is high after the first year. The customers who come back and purchase again in t ≤ 5 make the average lifetime value after five years (LTV5) of this cohort increase. The table above indicates that a customer picked randomly among the 100 initial customers is worth on average 18.5 CHF after four years since acquisition (LTV4 = 18.5). But what can we say about LTV5 and the full LTV?
The company made 50 CHF margin in 2020. Nevertheless, 2020 is not yet over (we assume we are in September 2020) and some customers may still purchase this year. This would increase the average margin, the LTV5 and the full LTV. Therefore, without using predictive methods, we cannot yet tell what a customer is worth after five years. To know this value, we must wait until the acquisition date of our customers is at least five years away from the current date, which in this example would be January 1st, 2021. Now, we can only tell that a customer is worth at least 19 CHF on average after five years (LTV5 ≥ 19). The general rule is the following: to calculate the LTVT after T periods, we must only consider individuals who have been customers at least T full periods. This rule is essential when analysing the LTVT of actual businesses which sell products to different cohorts on the same date.

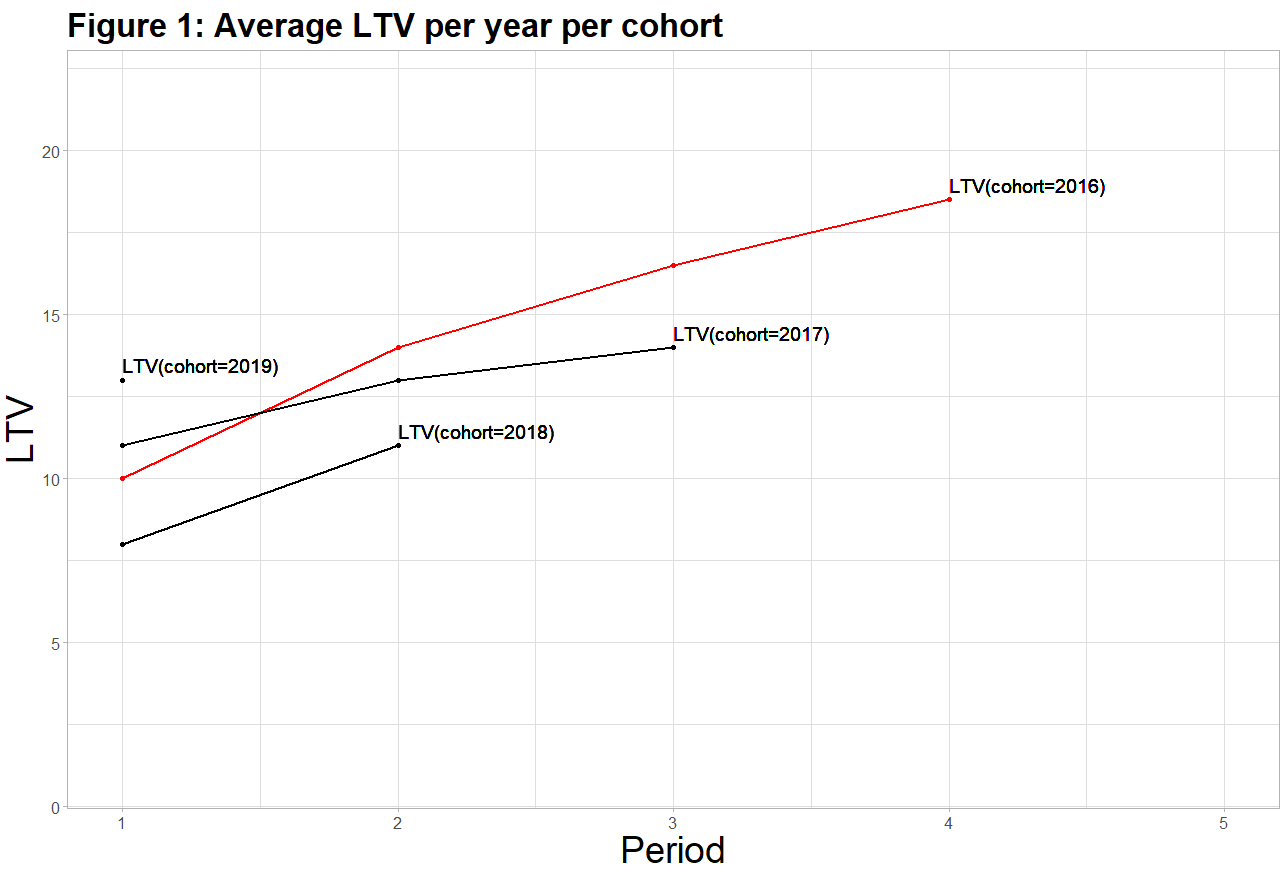
Figure 1 illustrates how LTVs can be represented when considering many cohorts. In red you see the cohort we analysed in Table 1 (cohort 2016). As discussed, its average LTV amounts to 18.5 after 4 periods (years) since registration. Now, let us assume our business acquires clients every year on January 1st. The clients we acquired on January 1st, 2017 form the cohort 2017 and so on.
As the cohort 2017 is one year “younger” than the cohort 2016, their average LTV can only be computed until period 3. In fact, the younger is the cohort, the smaller is the maximum period you can compute the average LTV for this cohort. The next section explains how you can compute an average LTV over all customers (mixing all the cohorts).
Calculating the average LTV over many cohorts
The above example was just to illustrate the logic to calculate the average LTV for a group of people you acquired at the same date. But in fact, you may acquire new customers every day. This section shows how to calculate the average LTV in the situation where you have many cohorts purchasing at the same time.
What data do you need?
To calculate the average LTV of your customers, you need at least the following information in your database:
- An order date
- A customer ID
- A registration date
- The margin
where every row is one order. Below is an example of a customer.

The method
The customer 1307 registered on April 12, 2019. According to his/her purchase history, he/she generated a margin of 338.55 CHF over 4 purchases in his/her first year of activity (t = 1). On his/her second year of activity, which is not yet over, he/she generated 130.46 CHF margin. Mathematically, we can say LTV1307,1 = 338.55 and LTV1307,2 ≥ 469.01. Reproducing this logic in the database for all customers would result in creating two new calculated columns: Period_year and Distance_year. Period_year indicates the period in which the customer made the purchase and Distance_year informs how many full periods have passed between the registration date of a specific customer and the current date. In Table 3, both columns have been added for the customer 1307.

To compute the average LTV over all the cohorts, you should follow these steps:
- Remove all orders which have a Period_year > Distance_year. This allows us to disregard all purchases made in not full periods.
- Sum the margin over all orders per Period_year.
- Sum the number of distinct customers who have at least t periods Distance_year for t = 1, 2, …, T.
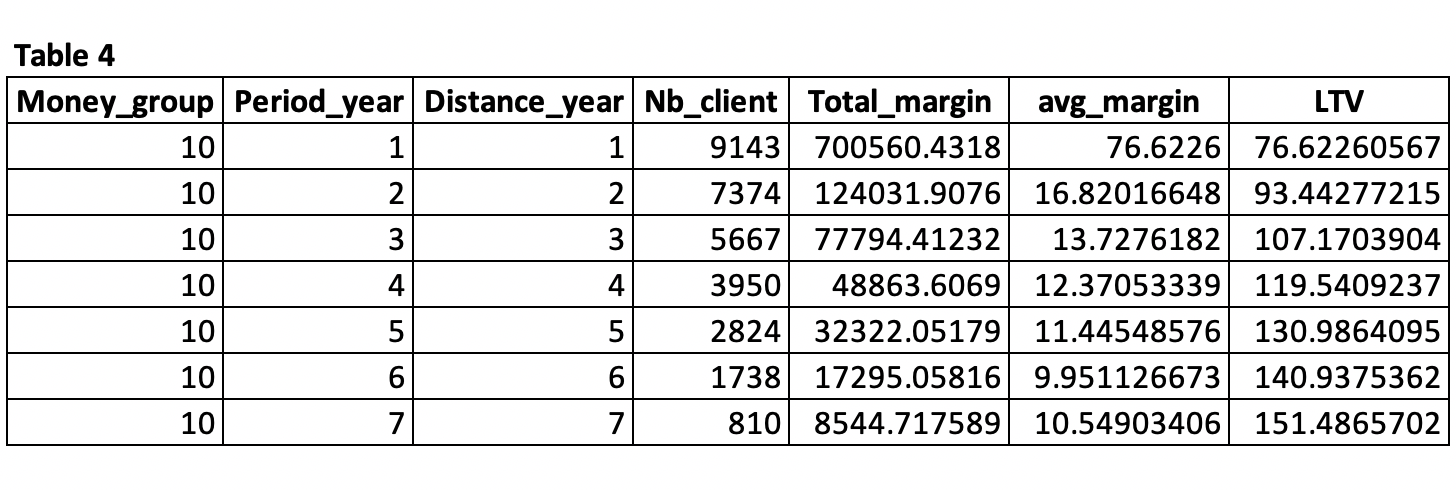
Following those steps, we end up with Table 4.

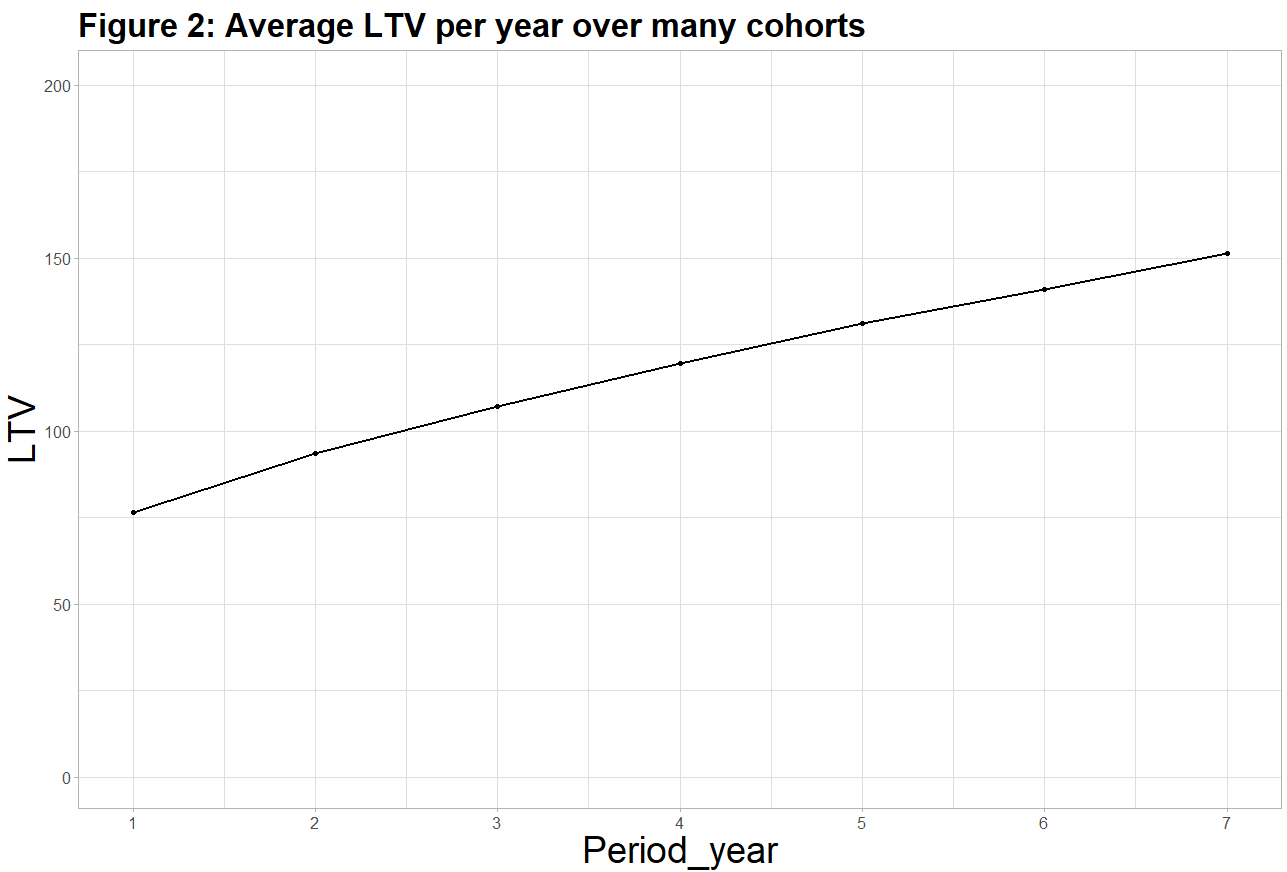
Table 4 above shows the LTVT for a real-life dataset. In period 1, there are 9143 customers who have been customers since at least 1 year. Those people generated 700’560.43 CHF margin. Following the same logic as with one cohort, you can compute how much a customer is worth after T periods. In our example, we see that a customer is worth on average 151.49 CHF after 7 years (LTV7 = 151.49). You can also see how the average LTV increases over the years.

Conclusion
With the information available in the database, we calculated how much a customer is worth on average after a specific number of years. This is a key metric for any marketer since it indicates how much you can spend at most to attract a new customer.
In the next article, I will discuss how to project the LTV to get the average full LTV predicted, how we can further segment customers in groups/cohorts and outline a few points you must pay attention to when computing the LTVs.


